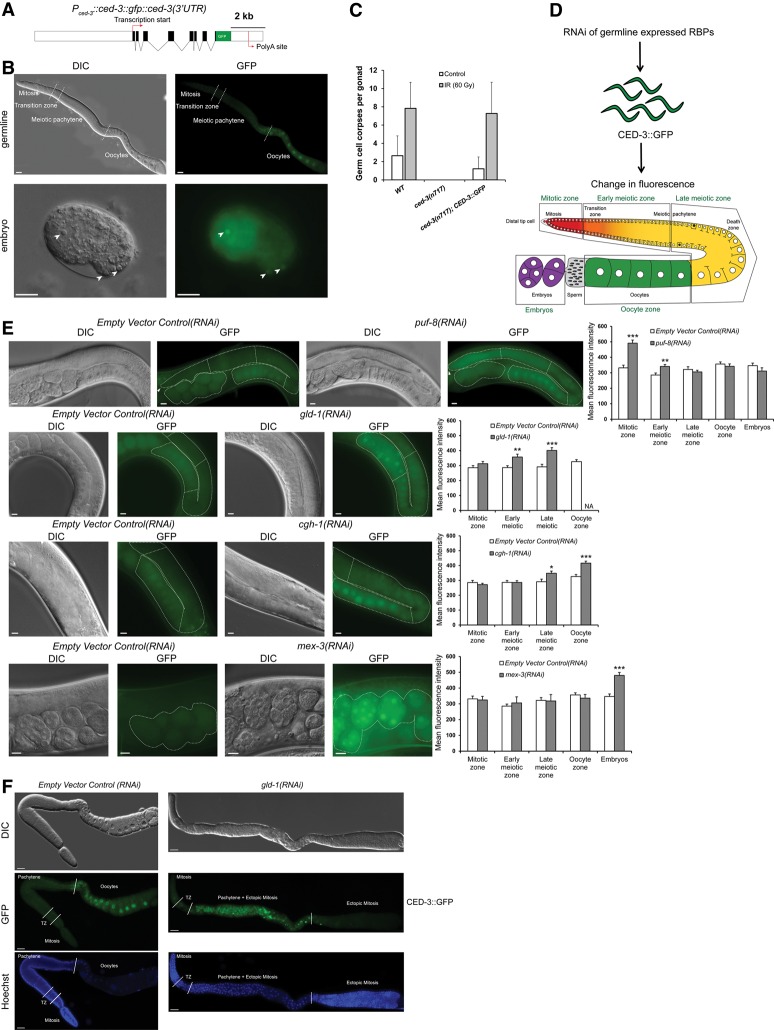
Figure 1.
RNAi screen for CED-3 regulators identified four conserved RBPs (PUF-8, GLD-1, CGH-1, and MEX-3) that negatively regulate CED-3 expression in different regions of the germline. (A) Structure of the reporter fusion with GFP [Pced-3::ced-3(genomic)::gfp::ced-3(3′ UTR)] used in this study. The promoter and 3′ untranslated region (UTR) elements are marked as white boxes, exons are marked as black boxes, and introns are marked as lines. (B) The CED-3 translational reporter (CED-3::GFP) shows germline and embryonic expression. Differential interference contrast (DIC) and GFP images of an adult germline and an embryo expressing CED-3::GFP are shown. White arrowheads indicate apoptotic corpses in the embryo enriched in CED-3 expression. Bar, 10 µm. (C) The CED-3::GFP translational reporter rescues the absence of physiological and irradiation-induced germ cell death in ced-3(n717) mutants. Error bars represent SD from two independent experiments. n = 25 animals per experiment. (D) Scheme of RNAi screen via feeding used to identify germline-expressed RBPs that regulate CED-3 expression. Four different germline areas (the mitotic, early meiotic, late meiotic, and oocyte zones) and fertilized embryos were monitored for change in fluorescence. (E) DIC and GFP images of the four positives from the screen that altered CED-3 expression: PUF-8 in the mitotic and early meiotic zones, GLD-1 in the early and late meiotic zones, CGH-1 in the late meiotic and oocyte zones, and MEX-3 in embryos. Empty vector control(RNAi) was used as a control. Average mean GFP fluorescence intensity was quantified in the five zones in 10–20 animals. Dashed lines outline the gonads, and arrowheads indicate the positions of the distal tip cells. Different zones selected for quantification (as in D) are separated with straight dashed white lines. Error bars represent SEM. n ≥ 10. Asterisks represent the P-value for a paired t-test comparing the reporter GFP intensity in RBP(RNAi)-treated and empty vector control(RNAi)-treated animals. (*) P < 0.05; (**) P < 0.01; (***) P < 0.001. Bar, 10 µm. (F) DIC, GFP, and Hoechst images of dissected gonads show increased CED-3::GFP expression in the meiotic pachytene region but not in the tumorous ectopic proliferative zone of fully depleted gld-1(RNAi) animals carrying the CED-3::GFP reporter. Bar, 10 µm. See also Supplemental Figures S2 and S4.

