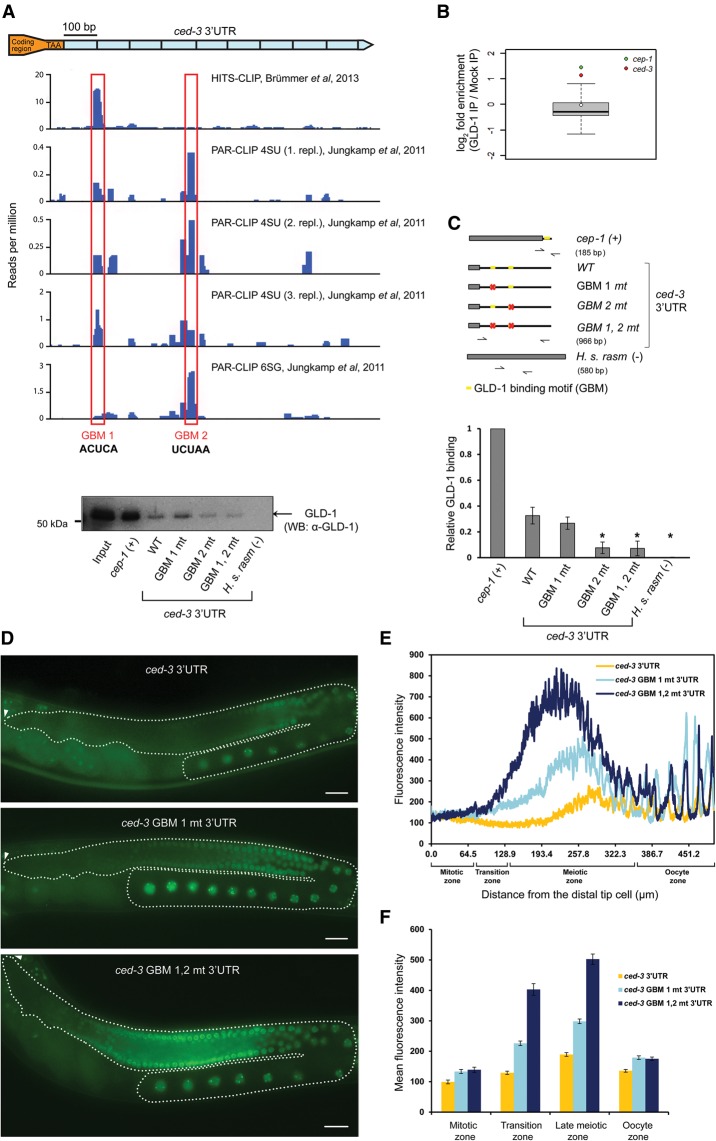
Figure 2.
Two GBMs in the ced-3 3′ UTR mediate ced-3 mRNA repression by GLD-1. (A) GLD-1 binds to the ced-3 3′ UTR: HITS-CLIP of GLD-1::STREP/HA (Brümmer et al. 2013) and PAR-CLIP of GLD-1::GFP::Flag (Jungkamp et al. 2011) identified two candidate GBMs in the ced-3 3′ UTR. (B) Following GLD-1 immunoprecipitation, ced-3 mRNA showed a level of enrichment similar to that of the p53 tumor suppressor homolog cep-1, a known GLD-1 target (Schumacher et al. 2005). Data are from Scheckel et al. (2012). (C) The two GBMs are essential for GLD-1 binding to the ced-3 3′ UTR in vitro. Wild-type and GBM-mutated ced-3 3′ UTRs were biotinylated and tested for their ability to interact with GLD-1 from worm extracts. The constructs used are shown at the left. cep-1 was used as a positive control, and human rasm was used as a negative control. GLD-1's presence in the immunoprecipitation sample was verified by Western blot with monoclonal anti-GLD-1 antibodies. The right chart shows relative GLD-1 binding as measured by band intensity quantification obtained from four independent Western blot experiments. An asterisk represents the P-value for a paired t-test comparing the construct with wild-type ced-3 3′ UTR binding. (*) P < 0.005. (D) GBM mutations caused a strong increase of GFP::H2B expressions in the meiotic region of the germline. GFP images of adult gonads expressing GFP::H2B fused to either a wild-type ced-3 3′ UTR [Ppie-1::gfp::h2b::ced-3(3′ UTR)] or a ced-3 3′ UTR in which one (ced-3 GBM 1 mt 3′ UTR) or both (ced-3 GBM 1,2 mt 3′ UTR) GBMs were mutated. Dashed lines outline the gonads, and arrowheads indicate the positions of the distal tip cells. Bar, 20 µm. (E) Quantification of GFP::H2B fluorescence intensity in ced-3 3 3′ UTR reporters as a function of distance from the distal tip cell shows additive contribution of the two GBMs in ced-3 repression. Average fluorescence intensities of three animals are plotted. (F) Mean fluorescence intensity in the four distinct areas of the germline of ≥15 animals. Error bars represent SEM. n ≥ 15. See also Supplemental Figure S3.

