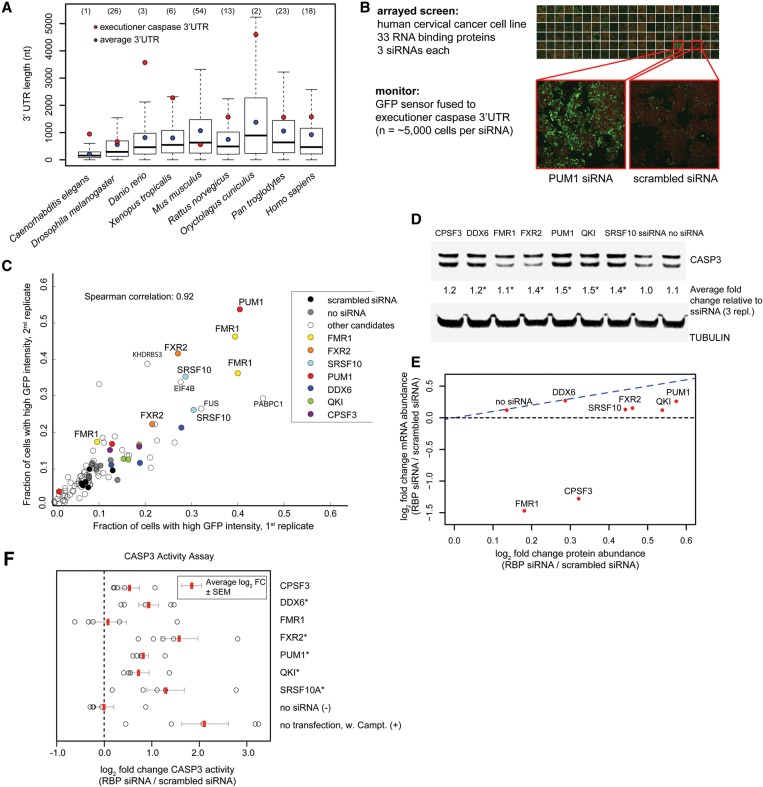
Figure 4.
Post-transcriptional regulation of human CASP3. (A) Executioner caspase 3′ UTRs are unusually long. Box plots show the distribution of 3′ UTR lengths across animal phyla. 3′ UTR lengths of executioner caspases (ced-3 in C. elegans, drICE in Drosophila, and caspase-3 in other species) are marked with a red dot. Median 3′ UTR length is represented with a line, average 3′ UTR is represented with a blue dot, and the whiskers extend to the most extreme data point, which is no more than 1.5 times the interquartile range from the box. Percentiles for the executioner caspase 3′ UTR length within a species are given in the parentheses above each organism. 3′ UTR lengths were extracted from the Ensemble Genes 75 database. (B) Image-based siRNA screen for post-transcriptional regulation of the caspase-3 3′ UTR. HeLa cells were treated with siRNAs against 33 RBPs. Caspase-3 levels were measured using the GFP::caspase-3 3′ UTR reporter (green), and cell outlines were detected by succinimidyl ester (red). (C) The fraction of cells with elevated level of GFP::caspase-3 3′ UTR reporter following knockdown of RBP. Three different siRNAs (represented as points) were used per gene. (D) Western blot of total CASP3 levels upon siRNA-mediated knockdown of candidate RBPs. The average fold changes in total CASP3 abundance following siRNA relative to scrambled siRNA and normalized to tubulin are shown. n = 3 biological replicates. (*) P < 0.05, paired t-test. (E) Comparison of mean caspase-3 protein with mRNA fold changes (log2) following knockdown of candidate RBPs. Caspase-3 protein and transcript levels (n = 3 biological replicates) were quantified by Western blot and bDNA single-molecule fluorescence in situ hybridization, respectively. (F) CASP3 activity following knockdown of the RBP candidates, measured via cleavage of the fluorogenic caspase-3 Ac-DEVD-AMC substrate. Treatment with the apoptosis-inducing agent camptothecin was used as a positive control. n = 5 biological replicates. Average log2 fold change (FC) in CASP3 activity (RBP siRNA/scrambled siRNA) is marked with red bar. Error bars represent SEM. (*) P < 0.05, paired t-test.

