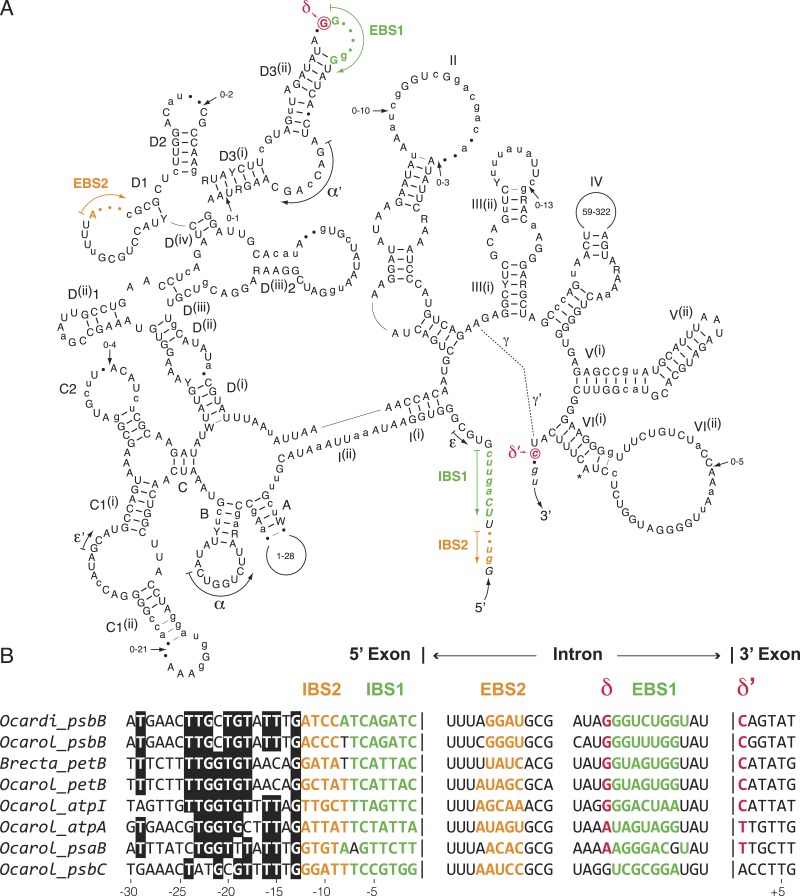
Figure 5. Comparative sequence analyses of eight chloroplast group IIA introns from the Oedogoniales.
(A) Consensus intron secondary structure displayed according to Toor, Hausner & Zimmerly (2001). Exon sequences are shown in italic characters. Highly conserved (in six or more introns) and slightly less conserved (in four or five introns) nucleotide positions are shown in uppercase and lowercase characters respectively; the remaining residues are denoted by dots. Highly conserved (in six or more introns) and slightly less conserved (in four or five introns) base pairings are denoted by thick and thin bars, respectively. Major structural domains and subdomains are specified by roman numerals and uppercase letters, respectively. Tertiary interactions are represented by dashed lines, curved arrows, or Greek letterings. EBS and IBS are exon-binding and intron-binding sites, respectively. The putative site of lariat formation is denoted by an asterisk. Variations in size of peripheral regions are indicated by numbers inside the loops or close to arrows. (B) Alignment presenting the exon sequences flanking the eight compared introns, along with the intron sequences containing complementary nucleotide residues (EBS1, EBS2 and δ). Colors highlight complementary nucleotide residues in the EBS/IBS and δ/ δ’ sequences.

