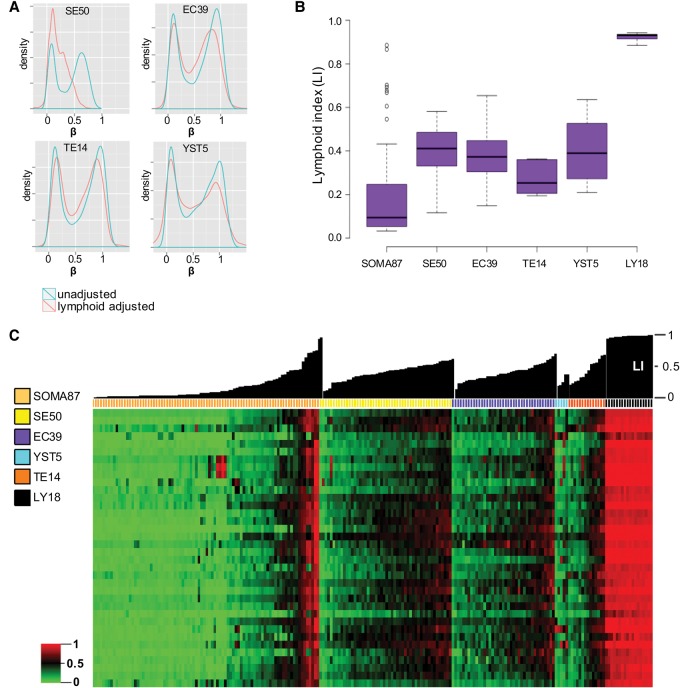
Figure 2.
Lymphoid cell fraction in TGCT samples. (A) Genome-wide methylation β-density distribution in TGCT subtypes, without and after correction for lymphoid infiltrates (blue and red traces, respectively) (see Methods). Notably, the lymphoid adjustment further exposes global methylation erasure in SEs, substantially shifting the peak methylation β-density closer to zero. (B) Box plots of lymphoid infiltrate levels in various TGCTs and reference sample groups as measured by lymphoid-specific methylation frequencies (i.e., LI; see Methods) reveal comparable levels across TGCT subtypes. (C) Heatmap of LS36 variable module (see Methods) and TGCT subtypes, with reference somatic tissues and purified lymphocytes (samples ordered by group and then by increasing LI); individual sample LI plotted above heatmap. The numbers of specimens investigated are indicated in the sample color legend. For abbreviations used, see text.

