Figure 2.
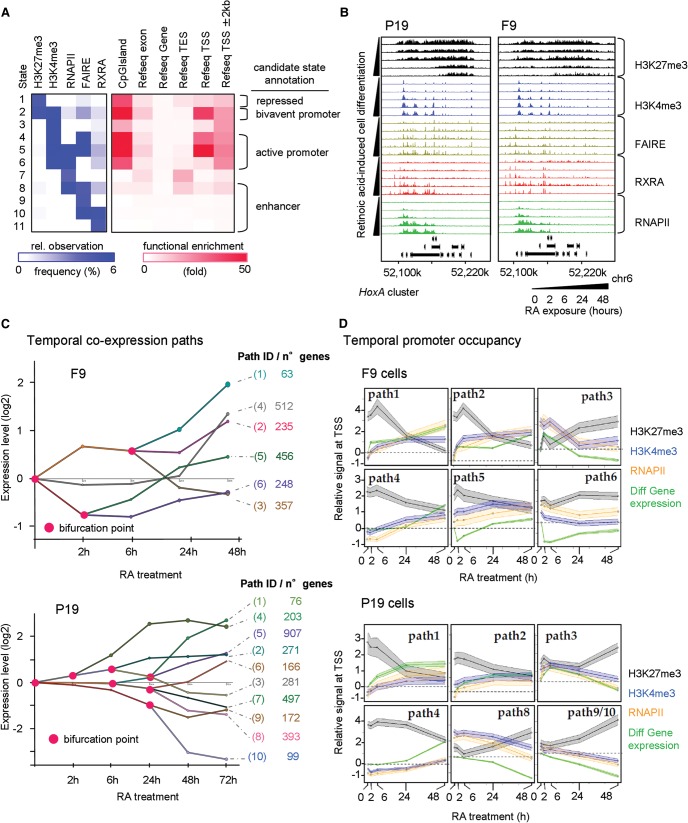
Multiparametric view of retinoid-induced cell fate transitions. (A) Chromatin state analysis performed over all profiled factors at all time points in P19 and F9 cells. Based on the predicted states resulting from a combination of all studied factors (left panel, relative observation frequency); four major candidate states were inferred: repressed, bivalent or active promoter, and enhancer-related states. This classification is supported by their functional enrichment levels associated with the described genomic annotations (right panel). (B) The HoxA cluster at Chromosome 6 displaying temporal changes in the enrichment of H3K27me3 and H3K4me3, the chromatin accessibility status (FAIRE-seq), the recruitment of the RXRA, and the transcriptional activity revealed by the profiling of the RNAPII. (C) Stratification of the temporal transcriptome profiling during RA-induced F9 (upper panel) or P19 cell differentiation (lower panel) in gene coexpression paths, accompanied by relevant bifurcation points (pink circles). Numbers of genes composing each of the coexpression paths are displayed (right). (D) Dynamics of promoter chromatin states during RA-induced F9 (upper panel) or P19 cell differentiation (lower panel). Gene promoters of the coexpression paths displayed in C are analyzed for temporal enrichment of (1) the repressive histone modification mark H3K27me3 (black), (2) the active histone modification mark H3K4me3 (blue), and (3) RNAPII (orange). Changes of mRNA levels relative to the noninduced condition are also displayed (“Diff Gene expression”; green). The y-axis corresponds to the average relative enrichment level derived from Epimetheus normalization (Supplemental Fig. S5). The shaded area corresponds to a 95% confidence interval.

