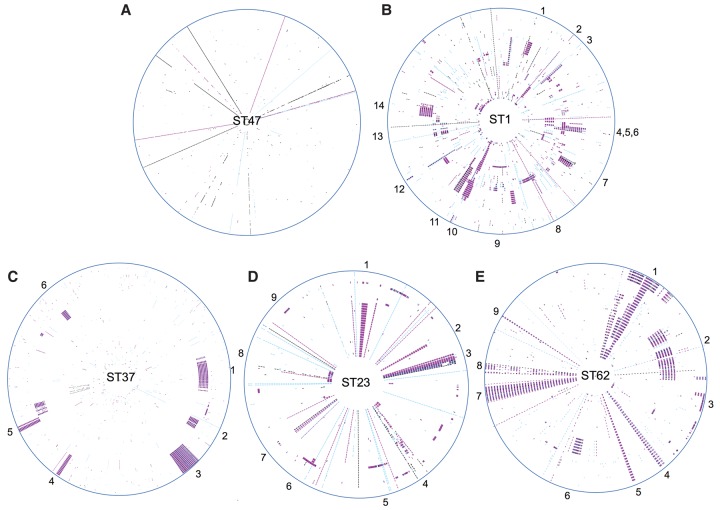
Figure 2.
Distribution of SNPs across L. pneumophila ST47 (A), ST1 (B), ST37 (C), ST23 (D), and ST62 (E) lineages. Circular representation of the five major disease-associated STs with each genome shown as a concentric circle. The maps were generated with the SynTView software. SNPs with respect to the reference genome are indicated by short lines in the concentric circle. Recombined regions can be seen as regions with a higher density of SNPs. SNPs are colored according to the type of mutation: (black) intergenic; (pink) synonymous; (blue) nonsynonymous. Around the outside circle, selected recombined loci are indicated with numbers, the content of which is provided in Supplemental Tables S5–S8. Access to the interactive SNP server is available at: http://genopole.pasteur.fr/SynTView/flash/Legionella_st/SynWebST1.html, http://genopole.pasteur.fr/SynTView/flash/Legionella_st/SynWebST47.html, http://genopole.pasteur.fr/SynTView/flash/Legionella_st/SynWebST37.html, http://genopole.pasteur.fr/SynTView/flash/Legionella_st/SynWebST23.html, http://genopole.pasteur.fr/SynTView/flash/Legionella_st/SynWebST62.html. The circular representation can be visualised using the “Circular” tab. An alternative linear representation can be displayed using the “Local View” tab (then by selecting the horizontal line between the arrows in the panel on the left hand side, then “snp” and “show/hide snps”).

