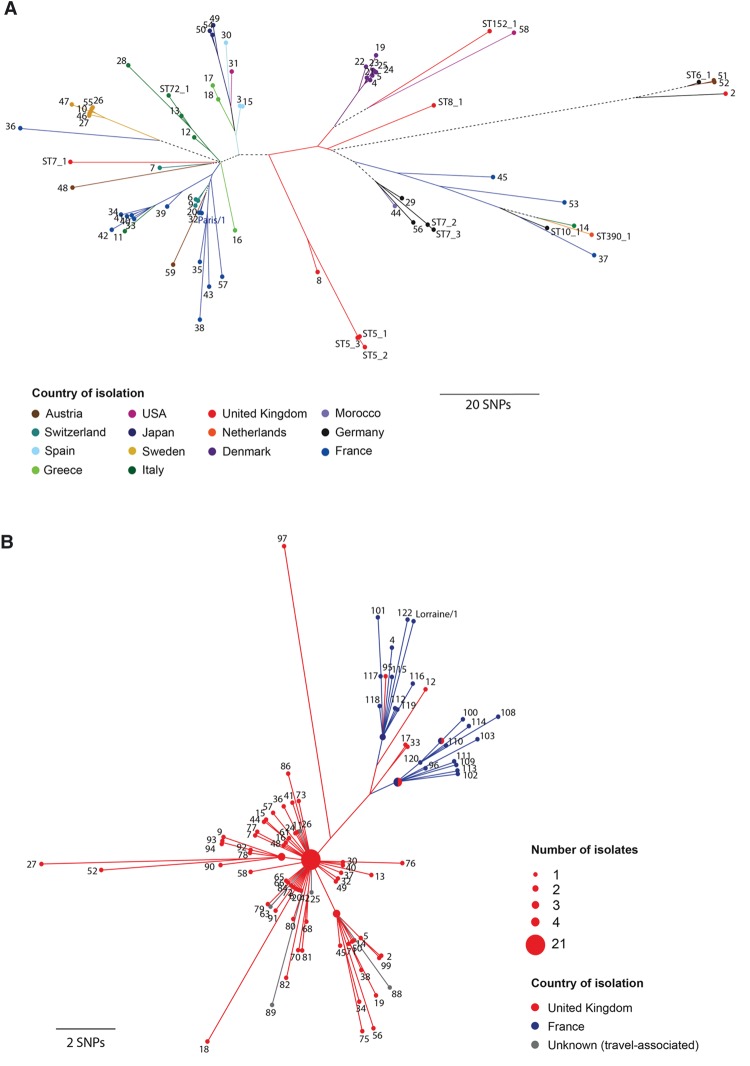
Figure 4.
Maximum likelihood trees of 71 ST1 and 122 ST47 isolates. (A) A phylogeny of ST1 isolates, constructed using 867 SNP differences remaining after recombined regions were removed. (B) A phylogeny of ST47 isolates, constructed using 186 SNP differences. Isolates are colored according to the country of isolation, and branches are similarly colored to indicate the origin of descendant nodes. A black dotted line is used where there are descendant nodes from multiple countries. The scales indicate the number of SNPs that have occurred for a given branch length.

