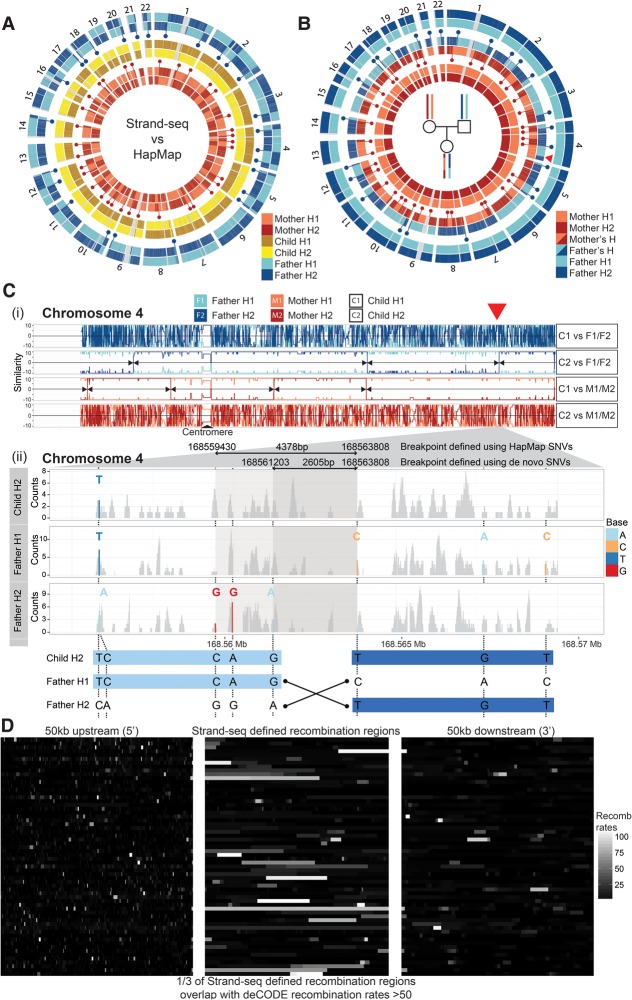
Figure 3.
Genome-wide mapping of meiotic recombination breakpoints in a family trio. (A) Circular plots of Strand-seq haplotypes (H1 and H2) assembled for a family trio (mother, child, and father) with each pair of homologs compared with the corresponding HapMap reference haplotypes. Only heterozygous SNV positions are plotted along each chromosome. Strand-seq haplotypes for the child (middle circles; yellow and brown) match the HapMap reference along the whole length of the chromosome (see also Fig. 2). Haplotypes from the mother (inner circles; light red and dark red) and father (outer circles; light blue and dark blue) show multiple switches (blue and red dots) between the Strand-seq haplotypes and those listed in the HapMap reference. (B) Comparison of the Strand-seq child's haplotypes to the Strand-seq parental haplotypes, with only the heterozygous SNV positions plotted for each homolog. We compared each of the child's haplotypes independently to both the parental haplotypes. Haplotype switches (blue and red dots) represent sites of meiotic recombination and occur at almost every chromosome, both from the maternal and paternal germline. (Red arrowhead) The switch event illustrated in C. (C,i) Similarity plot for Chromosome 4 depicting pairwise comparison of each child homolog (C1 and C2) with both parental homologs (F1 and F2, or M1 and M2, as indicated) (see Methods, “Mapping meiotic recombination breakpoints”). Lines depict continuous stretches of high (+10) and low (−10) similarity. A high similarity score (e.g., 10) indicated all SNVs were matched between the pairs, whereas a low similarity score (e.g., −10) indicated the homologs were dissimilar. This illustrates that, for this chromosome, C1 was inherited from the father and C2 was inherited from the mother. (Black arrowheads) Locations where the degree of similarity switched between the inherited parental homologs (e.g., from F1 to F2, red arrowhead) and mark locations of meiotic recombination. (ii) Enlarged region of Chromosome 4 showing the homolog-specific BAM files generated for child's homolog (C2) inherited from the father, as well as the corresponding paternal homologs (F1 and F2). Read coverage (gray) was plotted for each BAM file, with heterozygous SNVs highlighted (see legend). By use of these SNVs, the meiotic recombination breakpoint was narrowed to a 2605-bp region (bottom panel). (D) A comparison of the overlap of the meiotic recombination breakpoints predicted in this study to the hotspots reported in the deCODE project. The middle panel illustrates the genomic regions where a meiotic recombination breakpoint was found in our analysis, with each row depicting a distinct recombination event and the shade denoting overlap with the predicted deCODE recombination rates corresponding to these locations (white indicates high levels of recombination; black, low levels of recombination). The left and right panels show 50 kb upstream of and 50 kb downstream from the defined meiotic recombination breakpoint, respectively, again with the shade representing the overlap with deCODE recombination rates. We saw high concordance between our predicted breakpoints and those listed in the deCODE database, where one in three overlapped with deCODE regions predicted to have high (more than 50 standardized units) (Kong et al. 2010) meiotic recombination rates.

