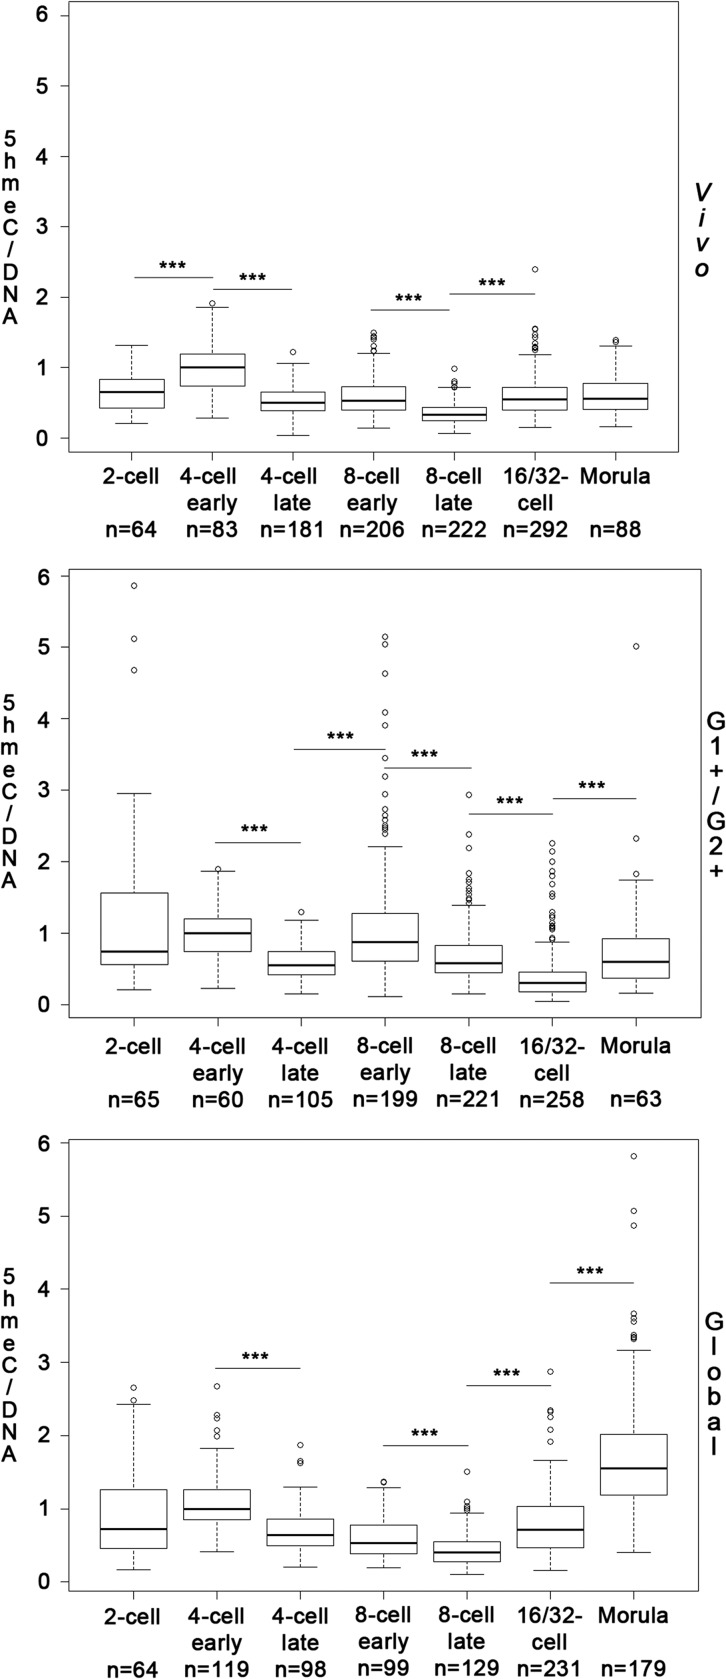
Figure 2.
Quantification of DNA hydroxymethylation during rabbit preimplantation development in different conditions. Boxplots showing the 5hmeC/DNA (EthD2) ratios obtained after quantification of immunofluorescence images in embryos developed in vivo (Vivo) or cultured in G1+/G2+ (G1+/G2+) or in Global (Global) medium and normalization by the median of the 4-cell early stage for each condition. The number of nuclei analyzed for each developmental stage is indicated below the corresponding stage. Significant differences between two consecutive stages are indicated on the graphic (*P < 0.01; **P < 0.005; ***P < 0.001).

