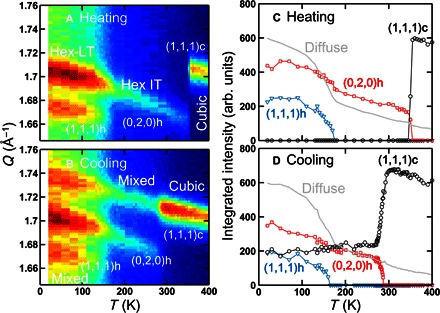
Fig. 2. Structural thermal hysteresis.

Elastic neutron scattering data obtained from FAPbI3 at SPINS, NCNR, upon heating (A and C) and upon cooling (B and D). (A) and (B) are contour maps of the scattering intensity as a function of momentum transfer, Q, and temperature, T. Q range of 1.65 to 1.76 Å−1 was covered to probe the distinctive nuclear Bragg peaks—(1,1,1)c, (0,2,0)h, and (1,1,1)h—associated with the cubic, Hex-IT, and Hex-LT phases, respectively. (C) and (D) are integrated intensities of the three peaks—(1,1,1)c (black circle), (0,2,0)h (red square), and (1,1,1)h (blue triangle)—as a function of temperature. The light gray line indicates the temperature-dependent diffuse scattering intensity, as explained in the text.
