
Fig. 5.
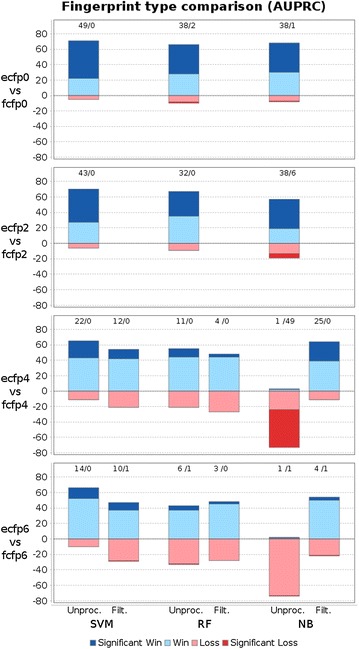
Win-loss statistics comparing ECFPs vs FCFPs at different diameters for unprocessed and filtered (1024) fragments. Each bar corresponds to a pairwise comparison of two methods on 76 datasets. Wins of the first/second method are colored in blue/red colors and drawn above/below zero respectively. Intense colors indicate significant wins/losses and are additionally stated in numbers above each bar. ECFPs are mostly better when using unprocessed features, except naive Bayes for diameters 4 and 6. The explanation is the lower number of features produced by FCFPs. When applying filtering, ECFPs always lead to more predictive models than FCFPs