Fig. 1.

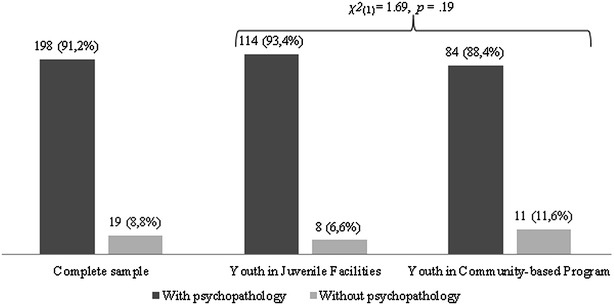
Frequency of global prevalence rate for the total sample and by groups. This figure presents the percentage of youth with and without psychopathology in the complete sample, as well as in the two groups

Frequency of global prevalence rate for the total sample and by groups. This figure presents the percentage of youth with and without psychopathology in the complete sample, as well as in the two groups