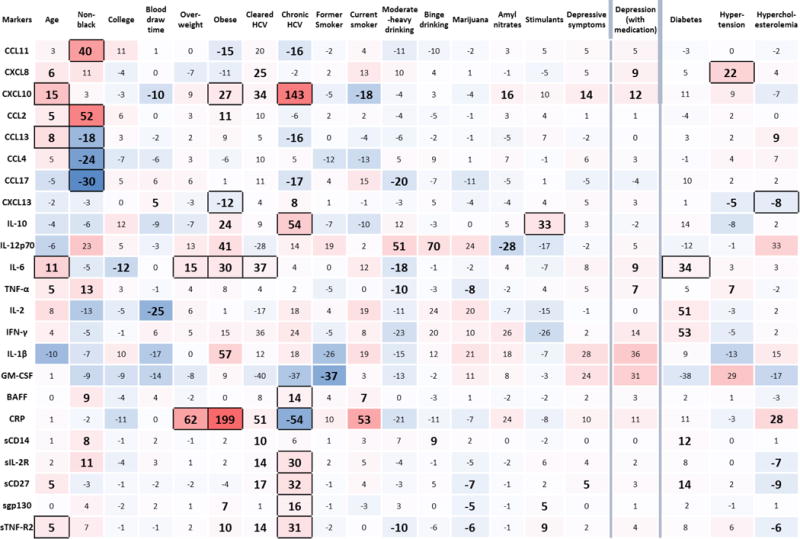
Figure 1.

Percent differences from multivariate generalized gamma regression models examining the associations of age, non-black race, college education at baseline, blood draw time (P.M. versus A.M.), being overweight, obesity, cleared (antibody positive only) hepatitis C infection (HCV), chronic hepatitis C infection, former smoking, current smoking, moderate-heavy alcohol consumption, binge alcohol consumption, use of marijuana, use of amyl nitrates, use of stimulants, the presence of depressive symptoms, and depression including those taking depression medication (column headings) with individual biomarkers (row headings), using the full sample (1984–2009). Percent differences in biomarker concentrations associated with persistent diabetes, persistent hypertension, and hypercholesterolemia are adjusted for age, study site, race, baseline education, blood draw time, body mass index, depressive symptoms, hepatitis C infection (HCV), smoking status, alcohol consumption, and recreational drug use, using the restricted sample (2001–2009). Large bold text with black-bordered cells indicates significance at the P<0.002 level; large bold text without borders indicates marginal significance (0.002<P≤0.05). The color gradient of each cell illustrates the magnitude of the percent difference in biomarker concentration (darker red indicating stronger positive percent difference and darker blue indicating stronger negative percent difference). For example, chronic HCV is associated with 54% higher concentrations of IL-10 (P<0.002) and 54% lower concentrations of C-reactive protein (CRP) (P<0.002).
