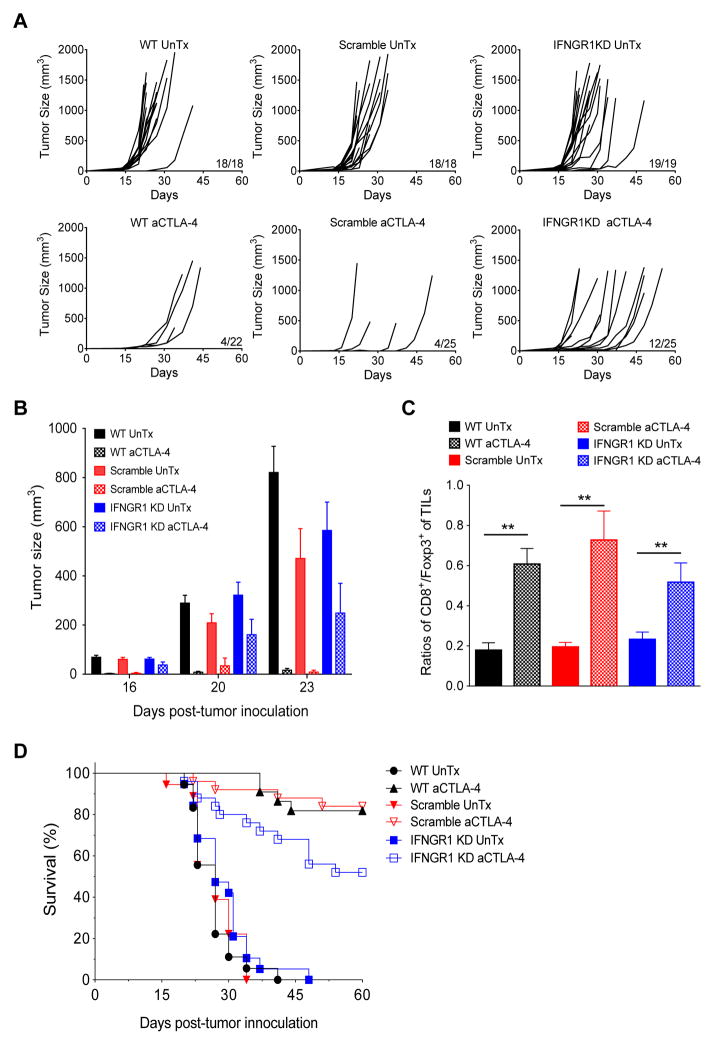
Figure 4. Knockdown of IFNGR1 gene in B16/BL6 tumors promotes in vivo tumor growth and reduces survival in response to anti-CTLA-4 therapy.
(A) In vivo tumor growth rate in B16/BL6 wild-type tumors as compared to scramble shRNA- and IFNGR1 shRNA-transduced tumors in mice treated with anti-CTLA-4 (lower panel). Upper panels are untreated controls (UnTx). (B) Tumor load of wild-type, scramble shRNA- and IFNGR1 shRNA-transduced tumors in mice treated with anti-CTLA-4. Data in the bar graphs are means ± SEM. (C) Ratio of CD8 T cells to Foxp3+ regulatory T cells in wild-type, scramble shRNA- and IFNGR1 shRNA-transduced tumors from mice on day 14 post anti-CTLA-4 treatment. Data in the bar graphs are means ± SEM; **p<0.01 by student’s t-test, as compared to the untreated controls. (D) Survival rate of mice bearing B16/BL6 wild-type tumors as compared to scramble shRNA- and IFNGR1 shRNA-transduced tumors with and without treatment of anti-CTLA-4. All data are pooled results from 2–3 independent experiments.

