Figure 5.
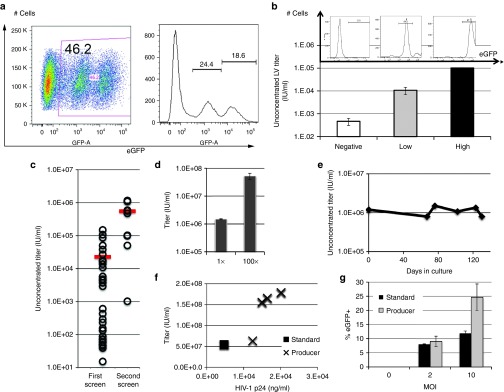
Generation of a GFP cocal LV producer cell line. (a) Flow cytometry analysis of bulk cocal producer cells expressing varying levels of enhanced green fluorescent protein (eGFP) fluorescence, represented by flow chart (left) or histogram (right). (b) Sorting of cocal producer cells from a based on eGFP fluorescence intensity (histogram) and corresponding mean lentiviral vector (LV) titer measured in each subpopulation (bar chart). Mean titer is obtained from two different dilutions of the vector and error bars show SE of the mean. (c) LV titer measured in single eGFP producer clones (open circles) or bulk cells (bar) after the first or second round of screening. Unconcentrated titer is given as infectious units/ml (IU/ml). (d) Unconcentrated (1×) and concentrated (100×) LV titers from the best eGFP producer clone identified in c from the first screen. Bar graph shows mean titer from one representative experiment using four different dilutions of the vector for transduction and error bars show SE of the mean. (e) Stability of eGFP LV producer cell line based on unconcentrated titer after long-term culture. (f) Functional titers plotted against HIV-1 p24 concentration (ng/ml) for different vector preparation made with the standard protocol (black square) or with producer cells (X). (g) Transduction of nonhuman primate (NHP) CD34+ cells by LV generated with the standard protocol (black) or with producer cells (gray). Different multiplicities of infection (MOI) of vector were used and cells were analyzed by flow cytometry at 6 days post transduction. Mean transduction efficiencies are from three independent experiments and error bars show SE of the mean.

