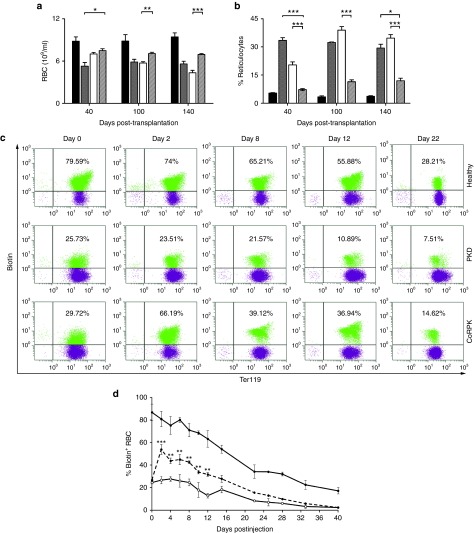
Figure 1.
Correction of pyruvate kinase deficiency (PKD) phenotype in peripheral blood of primary recipients after genetic correction. (a) RBCs and (b) reticulocyte levels in healthy (black bar, n = 5) and PKD anemic mice (gray bar, n = 6), and PKD anemic mice that were tranplanted with EGFP (white bar, n = 9) or coRPK-transduced cells (scratched bar, n = 17). Data are represented as the average ± SEM and were analyzed by nonparametric Kruskal-Wallis test. (c) Flow cytometry strategy used to detect the biotin-labeled RBCs throughout the time and (d) RBC survival kinetics in healthy (black dots, n = 2), anemic (white dots, n = 2) and genetically corrected mice (discontinuous line, n = 4). Data are represented as the average ± standard error of the mean and were analyzed by two-way analysis of variance test. Healthy, nontransplanted control mice; PKD, nontransplanted PKD mice; coRPK, PKD mice expressing the therapeutic transgene.

