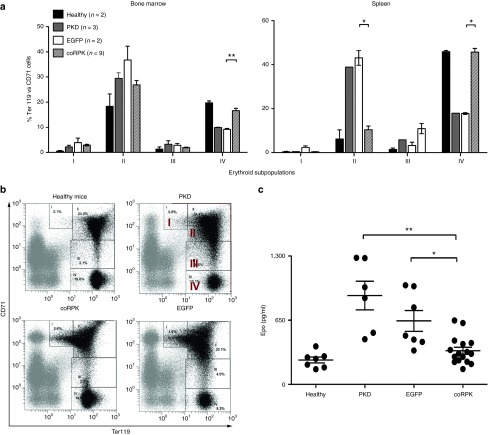
Figure 3.
Normalization of the erythroid differentiation pattern in genetically corrected mice. (a) Percentages of the different erythroid subpopulation in bone marrow and spleen at 140 days after transplant. (b) Representative dot plots of the flow cytometry strategy used. The expression intensity of the CD71 and Ter119 markers allows for identifying four erythroid subpopulations: population I: early proerythroblasts (Ter119med CD71high), population II: basophilic erythroblasts (Ter119high CD71high), population III: late basophilic and polychromatophilic erythroblasts (Ter119high CD71med), and population IV: orthochromatophilic erythroblasts, reticulocytes and mature erythroid cells (Ter119high CD71low). (c) Plasma Epo levels measured by enzyme-linked immunosorbent assay (ELISA) in nontransplanted and transplanted mice. Dots represent values of individual mice. Lines represent average ± standard error of the mean and were analyzed by nonparametric Kruskal-Wallis test. Healthy, nontransplanted control mice; PKD, nontransplanted PKD mice; EGFP, PKD mice expressing the EGFP transgene; coRPK, PKD mice expressing the therapeutic transgene. PKD, pyruvate kinase deficiency.

