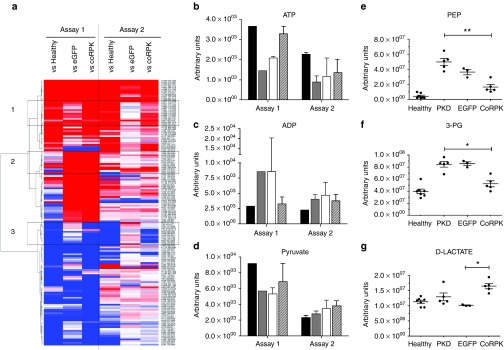
Figure 5.
Metabolic profiling in RBC samples from mice transplanted with genetically modified cells. Analysis of significant metabolic profile changes in healthy and transplanted mice by comparison to pyruvate kinase deficiency (PKD) animals in two independent experiments. (a) Complete RBC heat map obtained by untargeted profiling, where higher and lower metabolite levels are represented in red and blue respectively. Metabolites listed have at least one comparison that is significant using the following criteria: absolute fold change >1.5; minimal signal >2,000; adjusted P value < 0.01. Black boxes highlight cluster of metabolite changes with distinct profile among the groups. (b–d) ATP, ADP, and pyruvate levels in RBCs, respectively, measured by untargeted profiling by comparison to PKD mice at 140 days after transplant. Assay 1: Healthy mice (black bars) n = 1, PKD (gray bars) n = 1, hPGK-EGFP (white bars) n = 2, hPGK-coRPK (scratched bars) n = 3. Assay 2: Healthy mice n = 2, PKD n = 2, hPGK-EGFP n = 6, hPGK-coRPK n = 10. (e–g) RBC targeted metabolic profiling of a selected number of metabolites involved in the glycolytic pathway (phosphoenolpyruvate, 3-phosphoglyceric acid and D-lactic acid, respectively) at 280 days post-transplantation. Dots represent values of individual mice. Lines represent average ± standard error of the mean and were analyzed by nonparametric Kruskal-Wallis test. Assay 2: Healthy mice n = 7, PKD n = 5, hPGK-EGFP n = 3, hPGK-coRPK n = 5.

