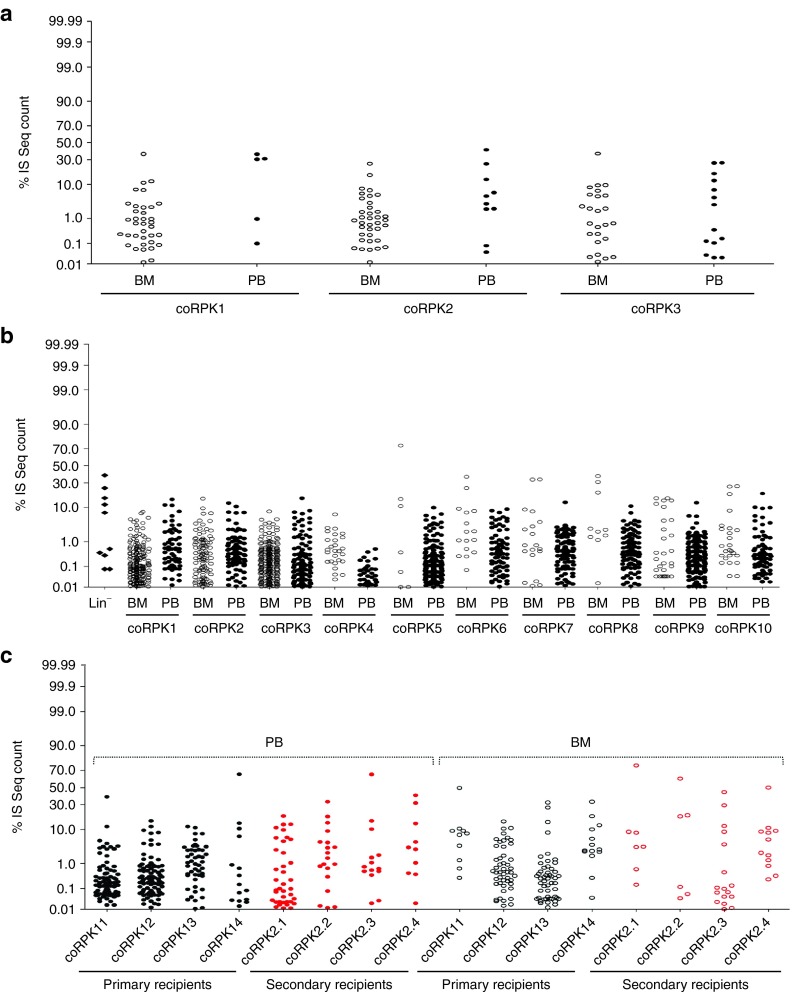
Figure 7.
Clonal abundance analysis of coRPK-LV-transduced cells. Dots plot representation of clonal abundance of pooled integrations in each mouse from assays 1 (a) and 2 (b,c). The relative percentage (y-axis) for each integration site is relative to the total number of sequences reads obtained in each dataset. BM, bone marrow; IS, integration site; PB, peripheral blood; coRPK1-14, mice transplanted with hematopoietic cells transduced with the therapeutic vector. coRPK 2.1-2.4, secondary recipients transplanted with BM cells from coRPK 11-14 primary mice.

