Figure 5.
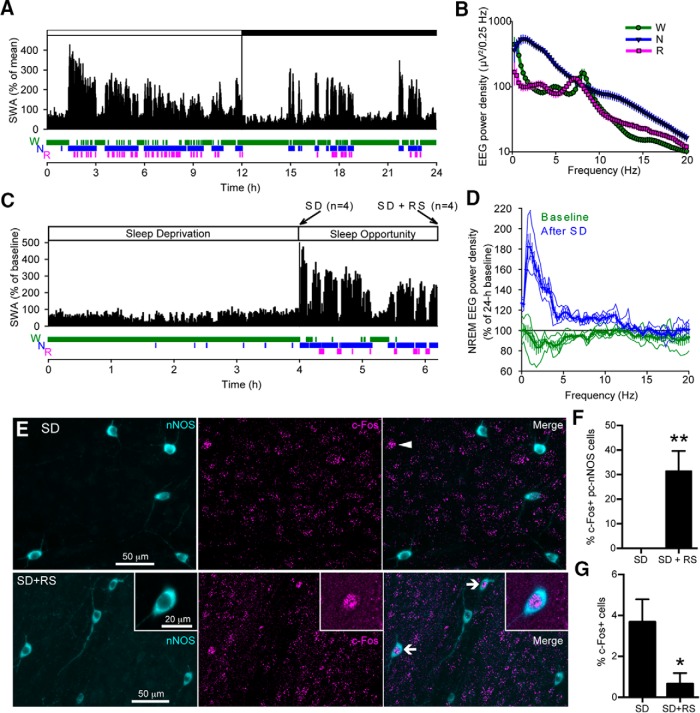
pc-nNOS neurons are activated during sleep. A, The 24 h profile of EEG SWA (EEG power between 0.5 and 4.0 Hz, displayed as the percentage of mean 24 h baseline; white bar, 12 h light period; dark bar, 12 h dark period) recorded in the frontal cortex and below the distribution of sleep–wake stages (W, wakefulness; N, NREM sleep; R, REM sleep) from a representative mouse. Note, as expected, that sleep predominates, and SWA shows a typical decline during the 12 h light period. B, EEG power spectral density during waking, NREM sleep, and REM sleep shown for the frontal EEG (n = 7). Note the state-dependent differences in cortical activity. C, Top, Representative profile of SWA during the 4 h SD and subsequent sleep opportunity/RS in one individual mouse. Bottom, The distribution of sleep–wake stages. Mice in the SD group were killed at the end of SD at ZT4 (n = 4), while the remaining mice in the SD+RS group (n = 4) were killed after the sleep opportunity. D, EEG spectral density in NREM sleep (displayed as a ratio of the mean 24 h baseline) during the sleep opportunity after SD (n = 4). Note the typical increase in SWA relative to the corresponding baseline interval after a period of prolonged waking. Thin lines represent the power density from single mice, whereas thick lines represent the mean power density from all four mice. E, Top panels, Confocal stack (z-stack, 29 μm) showing lack of c-Fos immunoreactivity in pc-nNOS cells after SD. A median filter was applied (x–y radius, 5 pixels). Arrowhead, A c-Fos+ cell immunonegative for nNOS. Bottom panels, Confocal stack (z-stack, 31 μm) showing c-Fos immunoreactivity in two pc-nNOS cells (arrows) following SD+RS. A median filter was applied (x–y radius, 5 pixels). Insets, Magnification of one the c-Fos+ pc-nNOS cells (z-stack, 5 μm; no filtering was applied). F, Quantification of c-Fos expression in pc-nNOS neurons. No pc-nNOS neuron expressed c-Fos following SD, whereas 31.4 ± 16.4% were c-Fos+ after subsequent RS (n = 4 per condition). G, Quantification of c-Fos expression in paracapsular Nissl-stained cells. Overall, c-Fos+ neurons were more abundant following SD (3.7 ± 1.1%) than during the subsequent RS (0.6 ± 0.5%, n = 4 per group) **p < 0.01; *p < 0.05. Data are presented as the mean ± SEM.

