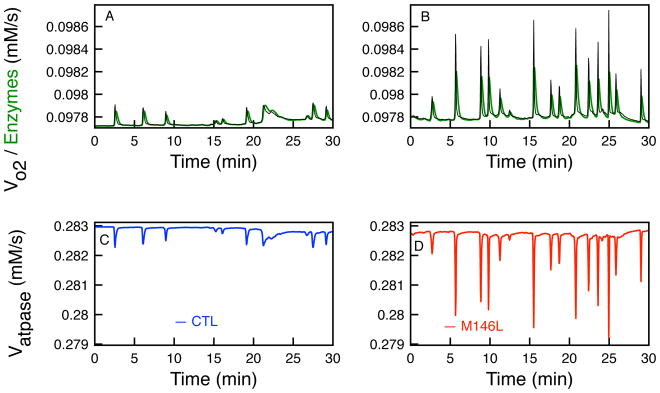
Figure 4.
The rates of the oxygen consumption (Vo2) and the total rate of the three enzymes (VIDH, VKGDH, and VMDH) that determine the concentration of NADH in the TCA cycle. Effects on oxygen consumption (black) and total enzyme rate (green) in control cells (A) and M146L-expressing cells (B). Rate of Vatpase as the changes in NADH occur due to uctuations in [Ca2+]i in CTL (C) and M146L-expressing cells (D).

