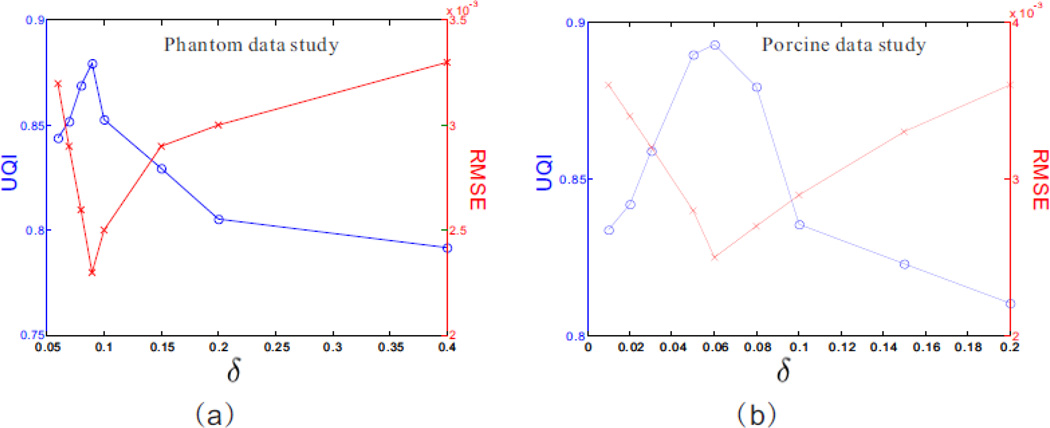
Figure 14.
The RMSE and UQI measurements for the presented MPD-AwTTV deconvolution algorithm with different δ values in the phantom (a) and porcine (b) data studies, respectively. The ‘blue solid line with circle marker’ and ‘red solid line with x-mark marker’ represent the UQI and RMSE measurements, respectively.

