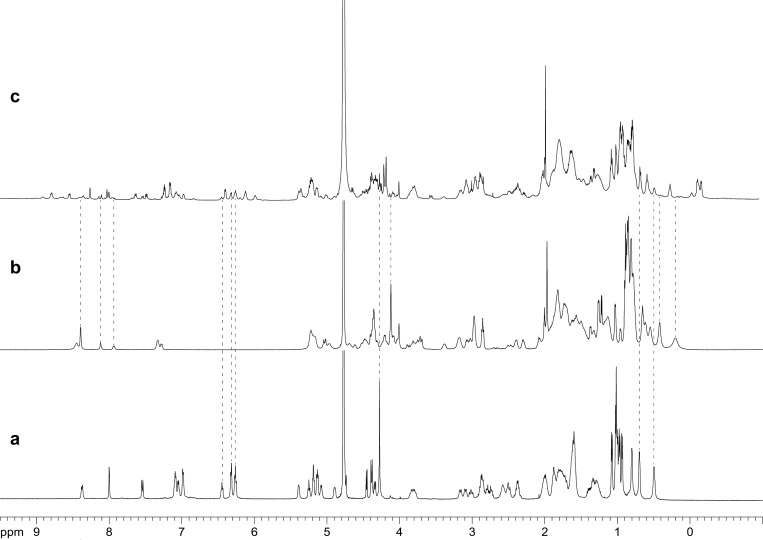
Figure 1.
1H NMR spectra of (a) peptide 1a at 8.0 mM, (b) peptide 1b at 8.0 mM, and (c) the 1:1 mixture of peptides 1a and 1b at 8.0 mM total concentration in D2O at 600 MHz and 298 K. Dotted lines illustrate how the resonances from the 1:1 mixture compare with the resonances of pure 1a and pure 1b.

