Figure 7.

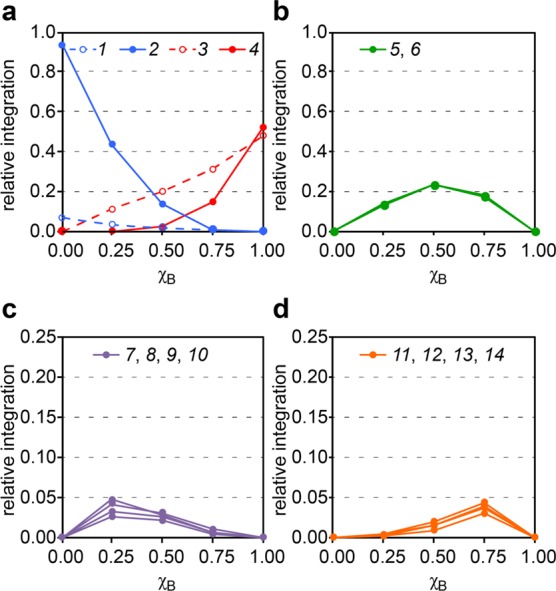
Plot of the relative integrations of crosspeaks 1–14 versus the mole fraction of peptide [15N]1b, χB. The intensities were measured by integrating the crosspeaks in the 1H,15N HSQC spectra of the mixtures of peptides [15N]1a and [15N]1b.

Plot of the relative integrations of crosspeaks 1–14 versus the mole fraction of peptide [15N]1b, χB. The intensities were measured by integrating the crosspeaks in the 1H,15N HSQC spectra of the mixtures of peptides [15N]1a and [15N]1b.