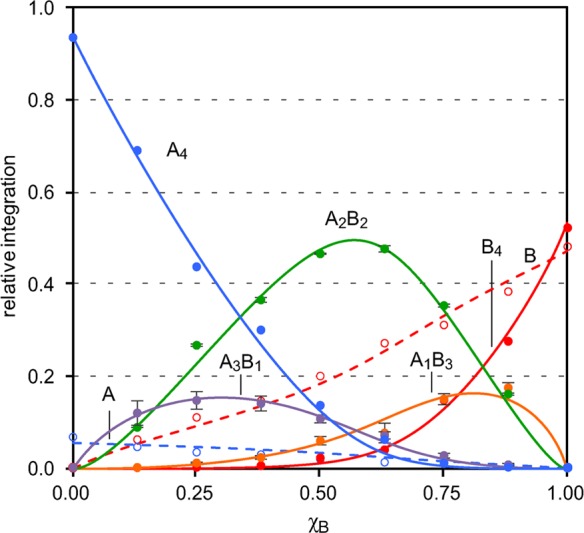
Figure 8.

Job plot for peptides [15N]1a and [15N]1b showing the relative integrations of the monomers, homotetramers, and heterotetramers versus the mole fraction of peptide [15N]1b, χB. The curves reflect a monomer–tetramer equilibrium model fitted to the data. The error bars reflect the standard deviations among the individual measurements used to determine the relative integrations of A3B1, A2B2, and A1B3. The relative stabilities determined for each species are ϕ4,4 = 1.00, ϕ4,3 = 0.22, ϕ4,2 = 0.67, ϕ4,1 = 0.12, ϕ4,0 = 0.12, ϕ1,1 = 0.36, and ϕ1,0 = 2.20.
