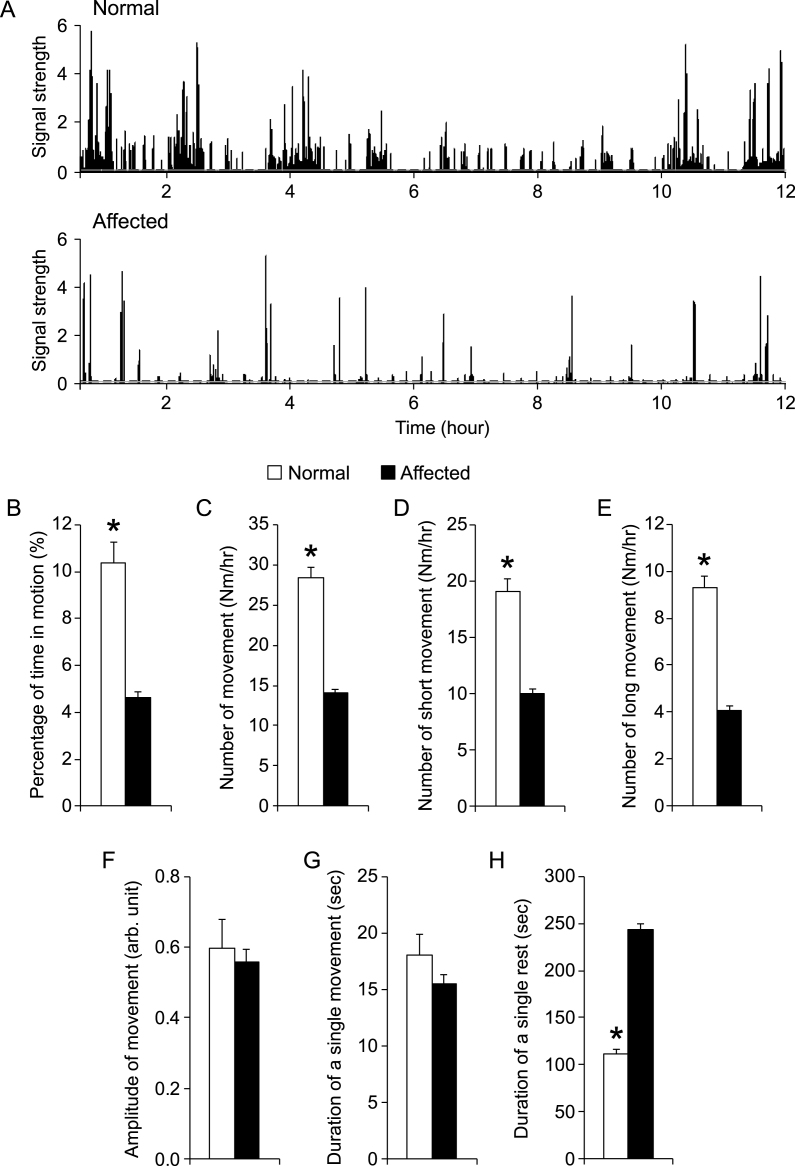
Fig.3.
Night activity was significantly reduced in affected dogs. A, Representative processed motion signals from a normal (top panel) and an affected dog (bottom panel). The normal dog showed more activity than the affected dog. Dotted line, motion threshold. B to H, A quantitative comparison of indicated night activity property between normal (n = 12) and affected (n = 22) dogs. Asterisk, p < 0.0001.

