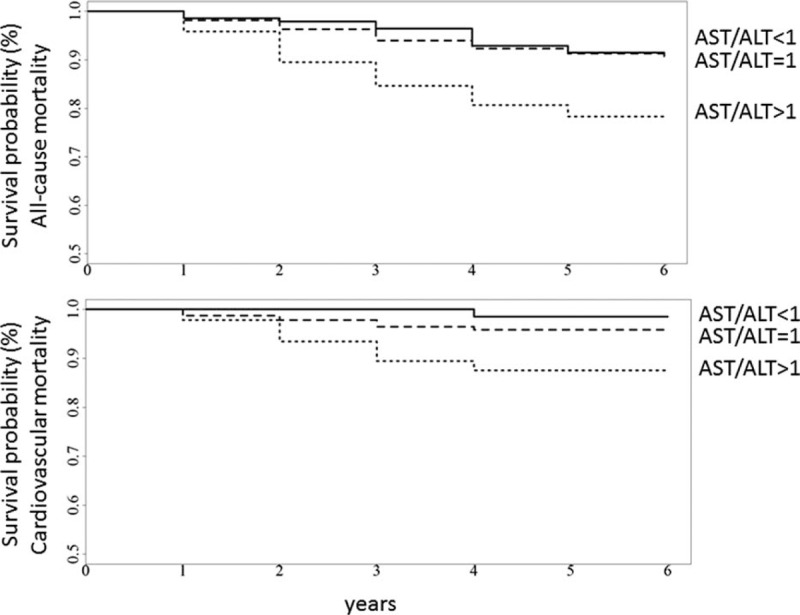
Figure 2.

Kaplan–Meier curves according to AAR categories in 2529 patients with type 2 diabetes. In the upper panel is reported the cumulative survival probability of all-cause mortality, whereas in the lower panel is reported the cumulative survival probability of CV mortality. The global statistical significance was estimated by log-rank test (P < 0.001 for both analyses). AAR = aspartate aminotransferase-to-alanine aminotransferase ratio, CV = cardiovascular.
