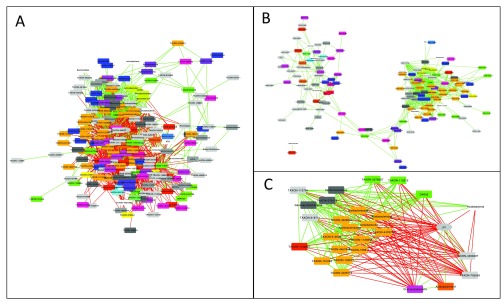
Figure 2.
A: Result network obtained for bacterial counts from the arctic soil 16S rDNA example data set, downloaded from the Qiita database. B: Same as A, but with negative edges discarded. The remaining edges form clusters with different microbial composition. C: Neighbors of the pH node form two clusters: one correlated and the other anti-correlated to pH, which reflects the opposite pH preferences of the cluster members.

