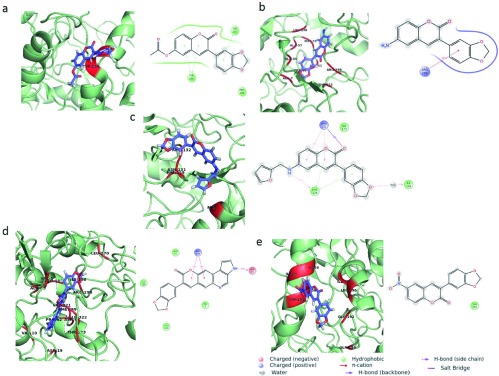
Figure 5a–e. Binding modes of IPCS-ligand complexes.
The interaction of the ligand within the IPCS inhibitor complex post MD simulation is shown the figure a) IPCS - compound 1 complex b) IPCS - compound 2 complex c) IPCS - compound 3 complex d) IPCS - compound 4 complex and e) IPCS - compound 5 complex. MD simulation was performed for a time period of 10ns. Interacting residues are represented in red.

