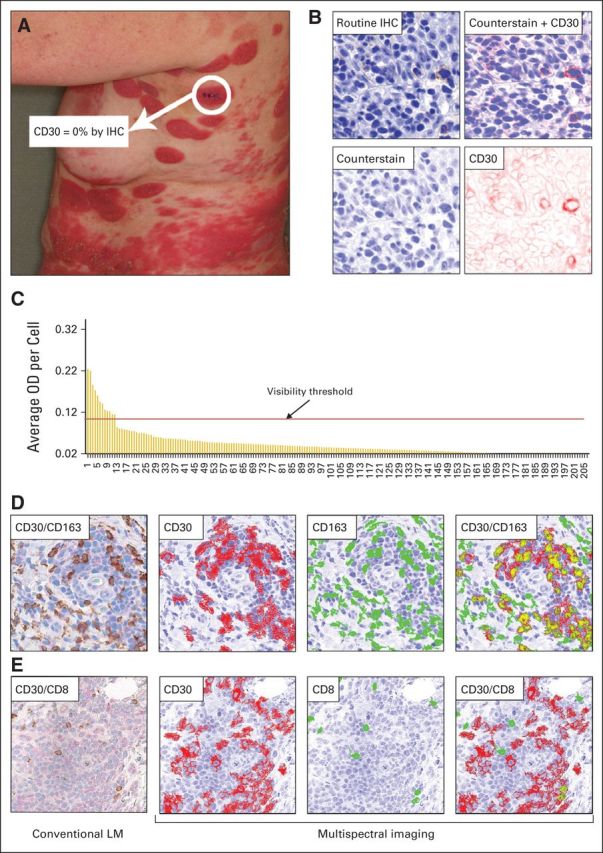
Fig 4.

Multispectral imaging (MSI) analysis of CD30 expression. (A) Clinical photograph of a patient at the time of screening. Immunohistochemistry (IHC) stain of the highlighted biopsy site showed CD30 level of 0% as assessed by conventional light microscopy (LM). (B) MSI series of a representative CD30 immunostained area from the same biopsy. The MSI system converts the standard light microscopic image into a pseudo-colored composite: the counterstain is shown in the pseudo color blue, and the CD30 is represented by the pseudo color red. The composite image can be unmixed into single components, counterstain and CD30. The CD30 panel highlights the CD30 stain in pseudo color red. (C) Histogram showing optical density (OD) values per cell in biopsy. Each bar represents the average OD value of an individual cell (n = 207 cells). Nonspecific background OD (0.02, including two stable disease) was subtracted from all values, and any bar therefore signifies specific CD30 staining. The visibility threshold indicates the OD below which CD30 stain was undetectable by visual inspection with conventional LM but positive by MSI analysis. (D) CD30 and CD163 double-stained lesional skin: conventional LM image of CD30 (light pink) and CD163 (brown) double stain. Here, the areas that exceed the nonspecific background OD for CD30 are shown in red, thus the color red depicts CD30 positivity. CD163+ cells are shown in green. The areas of spatial colocalization of both stains are highlighted in gold, demonstrating the extent of CD30 and CD163 coexpression in this lesion. (E) CD30 and CD8 double-stained lesional skin from the same subject: conventional LM image, showing CD30 (light pink) and CD8 (brown). Corresponding MSI of CD30+ (red) and CD8+ (green) cells and the coexpression of both markers (gold) in this area.
