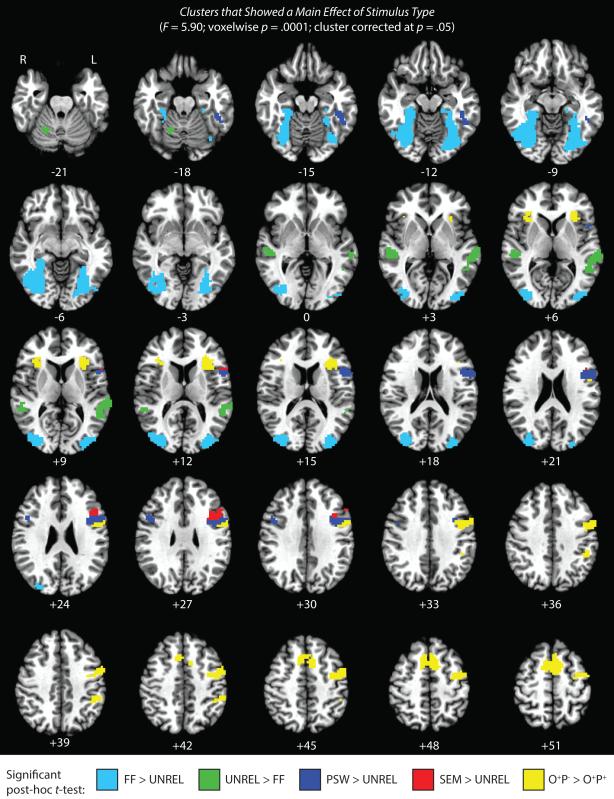
Fig 2.
Clusters that showed a main effect of stimulus type across the six visual conditions. Colors correspond to the results of Bonferroni corrected post-hoc pairwise t-tests between conditions of interest. Note that some clusters showed significant differences between conditions for more than one critical contrast; please refer to Table 3 for details. Numerals below each slice indicate Talairach co-ordinates in the axial plane. For the sake of simplicity, only clusters larger than 25 voxels in size are shown.

