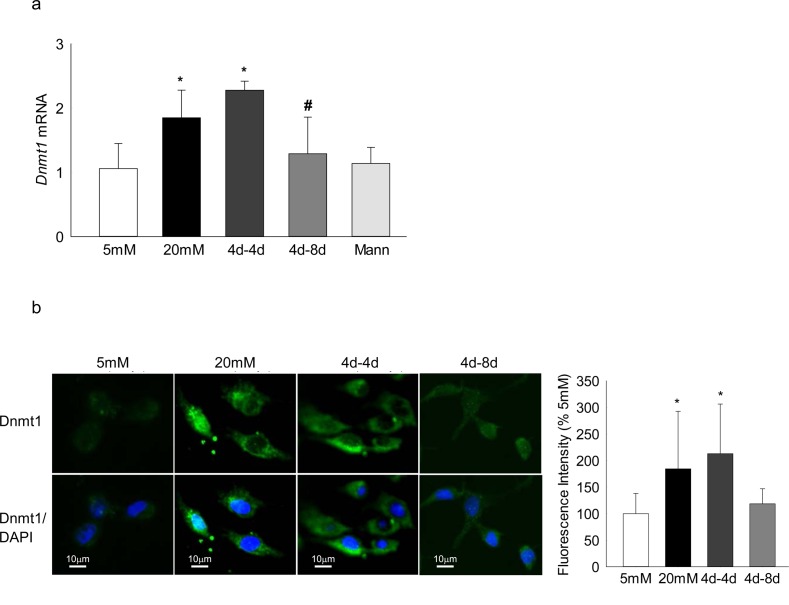
Figure 1.
Reversal of high glucose insult on Dnmt1 in retinal endothelial cells. Retinal endothelial cells were analyzed for the expression of Dnmt1 by (a) SYBR green–based q-PCR using β-actin as a housekeeping gene, and (b) immunofluorescence technique using Alexa-488–conjugated secondary antibody (green) and DAPI (blue) containing mounting medium. The images are representative of three different experiments, and accompanying histogram represents mean fluorescent intensity of Dnmt1 (green) quantified using ImageJ software (Version 1.4.3.67); values obtained from cells incubated in continuous 5 mM glucose medium are considered as 100%. 5 mM and 20 mM = cells in 5 mM glucose or 20 mM glucose; 4d-4d and 4d-8d = 4 days of 20 mM glucose, followed by 4 and 8 days of 5 mM glucose, respectively; Mann = 20 mM mannitol. Values are mean ± SD from four to five samples per group. *P < 0.05 vs. 5 mM glucose; #P < 0.05 vs. 20 mM glucose.

