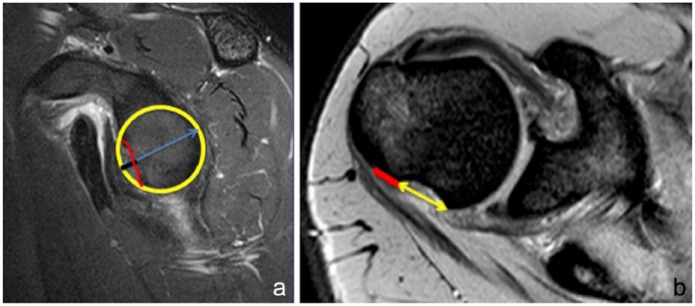
Figure 1.
(a) Calculation of the glenoid track. The inferior two-thirds of the glenoid approximates a circle, and the diameter of this circle represents the expected diameter of the glenoid. The glenoid track is calculated as 0.83 × diameter (yellow circle). Bone loss (red line) is measured as the distance from the edge of the circle to the edge of the remaining bone (black line) and is subtracted from the glenoid track measure. (b) Calculation of the Hill-Sachs lesion (HSL). On sagittal view, demonstrating the maximum bone defect, the HSL is the distance from the insertion of the rotator cuff to the medial edge of the HSL. The yellow line represents the Hill-Sachs defect, and the red line represents the bone bridge between it and the insertion of the cuff. These lines are added together to characterize the Hill-Sachs lesion used in the calculation of the glenoid track.

