
Figure 1.
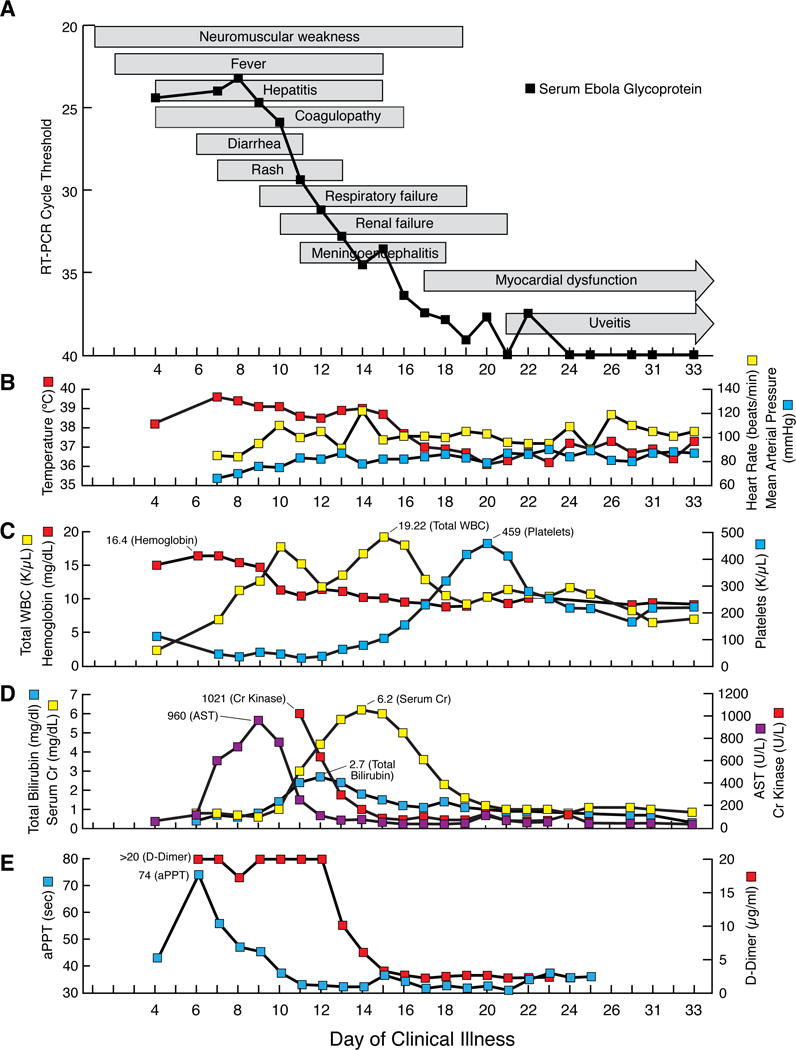
Sequential multi-organ failure in a patient with Ebola virus disease despite adequate blood pressure control: (A–E) Clinical course (A) text-boxes show approximate onset and resolution of clinical findings. Line-graph shows cycle threshold value that Ebola virus glycoprotein RNA was detected by quantitative reverse transcriptase polymerase chain reaction (RT-PCR) in serum. Select vital signs (B) red line-graph shows maximum daily temperature, yellow line-graph shows maximum daily heart rate, and blue line-graph shows minimum daily mean arterial blood pressure. Select laboratory values (C–E). Complete blood count (C) red line-graph show hemoglobin level, yellow line-graph shows total white blood cell (WBC) count, and blue line-graph shows platelet count. Serum chemistries (D) purple line-graph shows aspartate aminotransferase (AST) level, blue line-graph shows total bilirubin level, red line-graph shows creatinine kinase level, and yellow line-graph shows serum creatinine (Cr) level. Coagulation (E) blue line-graph shows activated partial thromboplastin (aPPT) level and red line-graph shows d-dimer level.