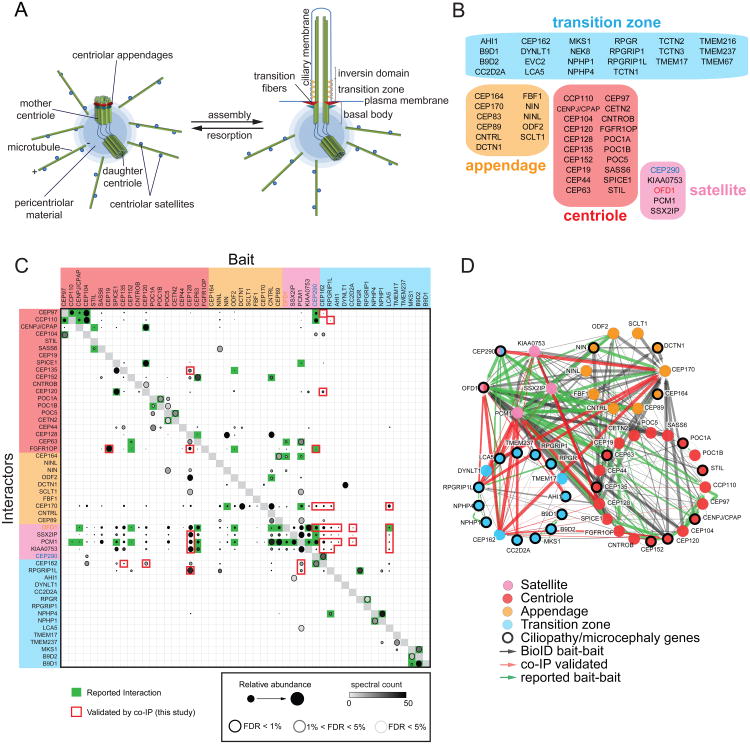
Figure 1. Proximity Mapping Of The Centrosome-Cilium Interface.
A. Schematic representation of the mammalian centrosome and centrosome/basal body-primary cilium interface. Distal and subdistal appendages are indicated in red and blue, respectively.
B. Bait proteins used in this study, grouped and color-coded according to primary localization. Note that CEP290 and OFD1 localize to both centriolar satellites and transition zone/centriole, respectively.
C. Mass spectrometry Dot Plot view of bait-bait interactions. Dot shading (grey – black gradient) indicates total number of spectral counts detected for each prey protein. Dot size indicates relative abundance of prey protein in each BioID analysis. Confidence levels for each bait-bait interaction according to SAINT (significance analysis of interactome; (Teo et al., 2014)) false discovery rate (FDR) are indicated by dot border (light grey <5% FDR; black <1% FDR). Green boxes, previously reported interaction; red box border, BioID bait-bait interaction validated here by co-IP. Four previously reported bait-bait interactions were verified by co-IP as controls (green box highlighted with red border). Baits not interacting with any other bait protein omitted for clarity.
D. Bait-bait PxIs detected in our study. Each node (color-coded circle) represents a unique bait protein associated with the indicated centrosome-cilium substructure. 70 previously reported (green edges), and 206 new (black edges) bait-bait interactions were detected. 30 bait-bait PxIs validated by co-IP highlighted in red. Edge thickness is proportional to peptide counts (maximum number of counts detected in a single MS analysis, or MaxSpec).

