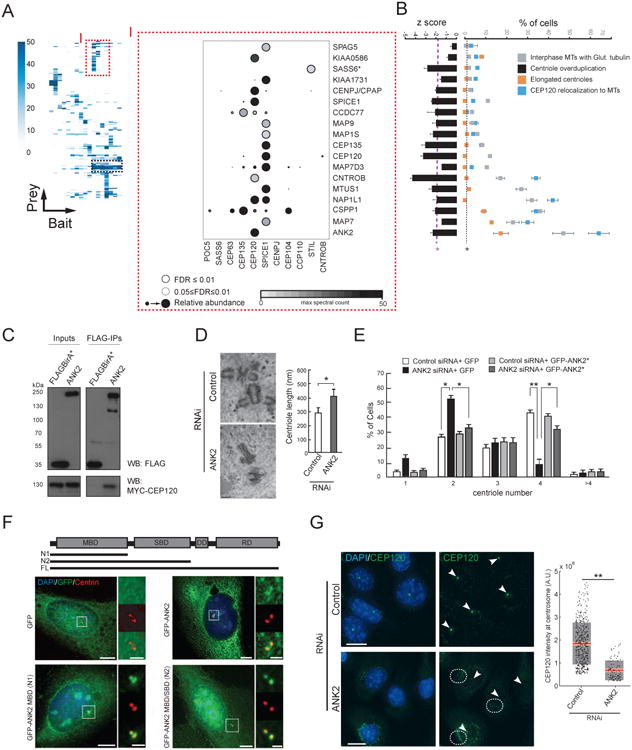
Figure 5. Local Proximity Profiles Identify Functional Clusters: (I) ANK2 Is A Component Of A MT Stability Module That Regulates Centriole Duplication.

A. (left) Hierarchical clustering reveals modules with similar proximity profiles (dashed boxes). Peptide counts (MaxSpec) indicated for each interactor (from complete cluster map in Table S6). (right) Mass spectrometry DotPlot of selected baits from the region of the CEP120/SPICE1 cluster denoted by “I” (as in Figure 1C, see legend). *SASS6 was not part of this interactor group, and is included here as a control (see B).
B. (left) Interactors (presented in the same order as in A) were profiled for suppression of centriole amplification (see Figure 4A); (right) Qualitative phenotypes related to MT organization (see legend and Experimental Procedures). Dashed purple (overduplication assay) or black (all other assays) lines represent 1.9 and 2 S.D. of the mean of negative control values (*p<0.05, N>100, three replicates), respectively. Negative control values for MT phenotypes were <2% in all cases (not shown).
C. Western blots (as indicated) of input (left) or FLAG IP (right) conducted on lysates from 293 T-REx cells stably expressing FLAGBirA* (tag alone; control) or FLAGBirA*-ANK2, transfected with MYC-CEP120.
D. (left) Electron micrographs of U-2 OS Tet-inducible Myc-PLK4 cells transfected with control (top) or ANK2 (bottom) siRNA for 72 h. At 48 h post-transfection, hydroxyurea and tetracycline were added for 24 h to arrest cells in S-phase and induce centriole overduplication. (right) Average centriole length (±S.D.) in each population (*p=0.03, Student's t-test, N>15). Scale bar 200nm.
E. Effect of ANK2 depletion on centriole number. U-2 OS lines carrying Tet-inducible GFP or the siRNA-resistant GFP-ANK2 (GFP-ANK2*) transgenes were transfected with control or ANK2 siRNA for 72 h. At 48 h post-transfection, tetracycline and hydroxyurea were added to induce ANK2 expression, and arrest cells in S-phase for 24 h. Cells were fixed and labelled with anti-centrin, and the number of centrioles per cell was counted. Bar graph, percent cells with indicated centriole number (N>300, 3 replicates, *p<0.05, **p<0.01).
F. Full length (FL) and truncation constructs of GFP-ANK2 (top) were transfected into U-2 OS cells, and (left) IF microscopy was used to characterize localization at the centriole (boxed in white) with a marker (centrin). (right) Insets from top to bottom: GFP; centrin ; pseudocolor merge. Scale bar 10μm, insets 3×.
G. Representative micrographs (left) of U-2 OS cells treated with control (top) or ANK2 (bottom) siRNA, and labelled with antibodies to endogenous CEP120 (green). White arrowheads denote centrosomal CEP120 puncta. Cytoplasmic regions where CEP120 has relocalized are encircled by white dashes. Scale bar 15μm. (right) Quantification of CEP120 levels at the centrosome (N>300, three replicates, **p<0.01, Student's t-test). Grey region denotes 2 S.D. from the mean (red line) and pink region denotes the 95% confidence interval.
