
Figure 3. Plasma tau and CSF total tau (T-tau) and phosphorylated P-tau.
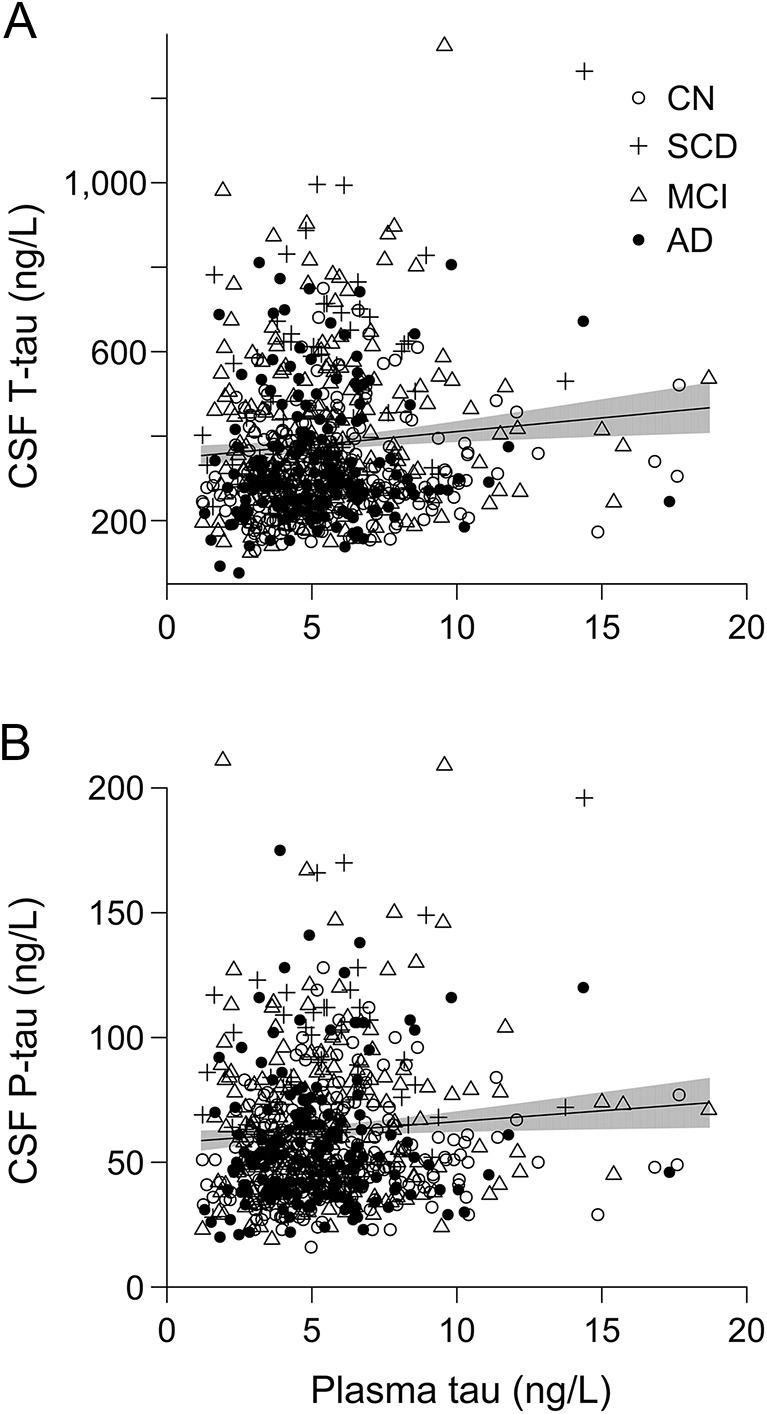
Data from Biomarkers for Identifying Neurodegenerative Disorders Early and Reliably (BioFINDER). The trend lines are for the associations between plasma tau and CSF T-tau (β = 6.46, 95% confidence interval [CI] 2.17–10.76, p = 0.0033; A) and P-tau (β = 0.87, 95% CI 0.15–1.58, p = 0.034; B) in linear regression models adjusted for APOE ɛ4, diagnosis, age, and sex. The shaded areas indicate 95% CI. The β coefficients are on the original scales of CSF T-tau and P-tau; see the text for coefficients using standardized data. AD = Alzheimer disease; CN = cognitively healthy controls; MCI = mild cognitive impairment; SCD = subjective cognitive decline.