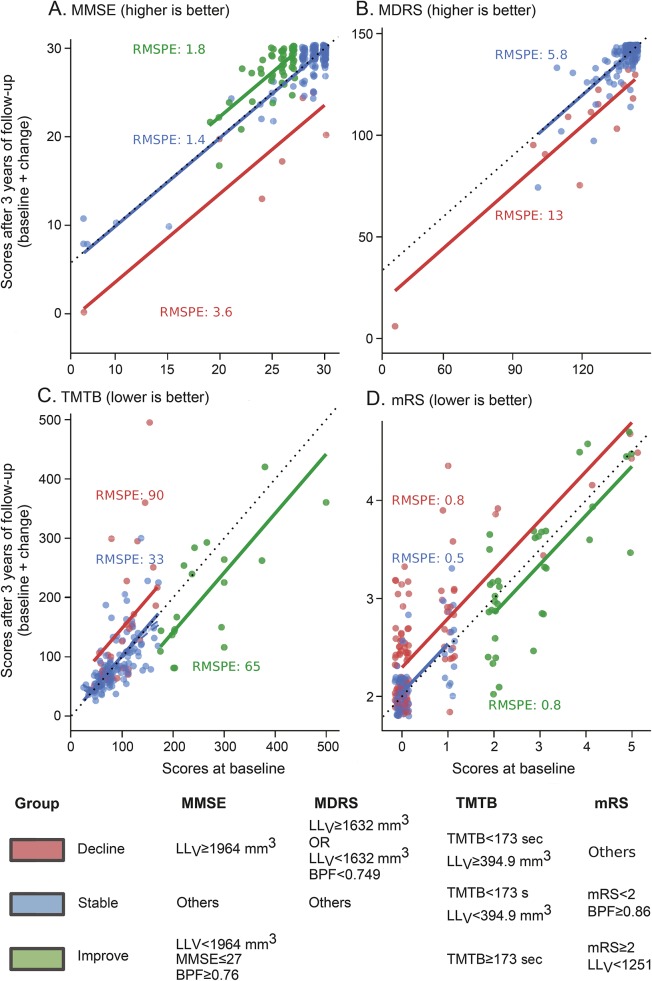
Figure 3. Follow-up scores as a function of baseline scores according to patient group.
(A) Mini-Mental State Examination (MMSE), (B) Mattis Dementia Rating Scale (MDRS), (C) Trail Making Test part B (TMTB), (D) modified Rankin Scale (mRS). Three-year follow-up scores as a function of the baseline value. Each single point corresponds to 1 patient, on the horizontal axis the initial value of the considered score and on the vertical axis the corresponding value after 3 years of follow-up (a small amount of jitter has been introduced to help read similar values, explaining why some points can appear to have decimal values). Solid color lines correspond to predictions obtained by recursive partitioning tree models. The predicted value of the considered score after 3 years is obtained by projecting onto the vertical axis the intersection between the baseline value on the horizontal axis and the solid line corresponding to the patient's group. The black dashed line stands for stability, where follow-up score equals baseline. For each group, we report the root mean squared prediction error (RMSPE), which is an estimate of the prediction error calculated from 200 bootstrapped replications. As illustrated by the dispersion of colored points around solid lines, the prediction error at the individual level is inversely related to the sample size. LLV = volume of lacunes.

