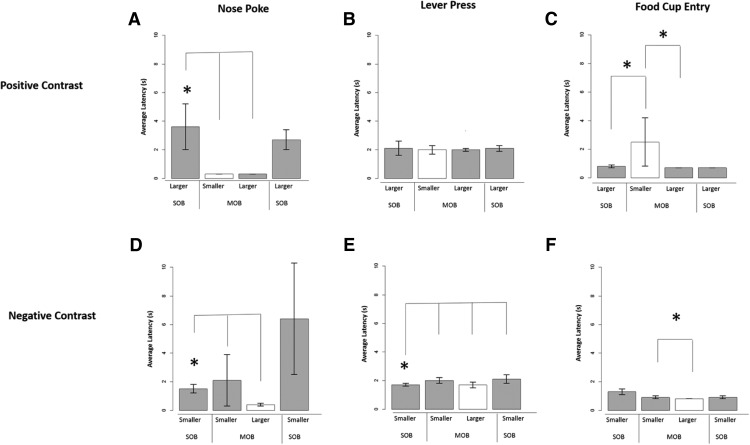
Figure 3.
A–F, Behavioral response latencies during positive-contrast (A–C) and negative-contrast (D–F) session types. A, Nose poke: there was a generalized decrease in response latencies during the MOB session when compared with the SOB session. B, Lever-press: the lever-press response did not significantly differ between the single- and mixed-outcome sessions or during the smaller vs larger trials in the mixed session. C, Food cup entry: results showed an increase in food cup entry latencies during the mixed session, as well as a significant discrimination effect during this same session block. D, Nose poke: there was a generalized decrease in response latencies during the mixed session when compared with the single-outcome session. E, Lever-press: animals showed steady increases in latency to lever-press over trial blocks for the smaller reward outcome. F, Food cup entry: results showed significantly longer latencies to enter the food cup during smaller than larger reward trials in the mixed-outcome session. Bars represent averages of normalized data, and error bars denote the SEM for each outcome presentation. Gray bars depict the similar outcome across trial blocks, and white bars depict the alternate outcome.

