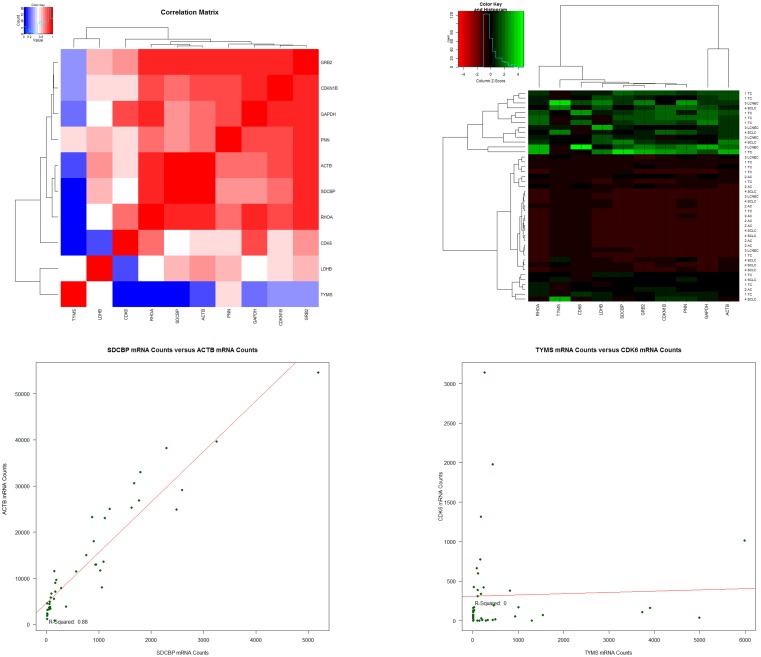
Fig 2. A to D show a correlation matrix for gene expression (A), a heatmap for tumor type versus gene expression (B), scatterplots (C and D) for gene versus gene correlations and R2 calculation.
Fig 2A depicts a correlation matrix of genes that were identified as potential reference genes by geNorm and NormFinder algorithms and previously identified tumor markers (CDK6 and TYMS). High correlations are outlined by red colored squares. Between CDKN1B, GRB2 and GAPDH as well as between ACTB, SDCBP and RHOA a high correlation was identified. Low correlations are indicated by blue squares and were found for tumor markers (CDK6 and TYMS) versus reference gene. Fig 2B displays a heatmap. On the x-axis the potential reference genes and tumor markers CDK6 and TYMS are shown. On the y-axis the investigated tumor types are depicted. Differential expression was found between tumor types. Though, the reference genes show a constant expression cluster (either low or high) between the samples investigated. The tumor markers present with differential expression between all samples without showing a specific cluster. Fig 2C and 2D are exemplary scatterplots of gene versus gene correlation, which were created to calculate the coefficient of determination (R2). Fig 2C depicts the highest correlation identified (R2 = 0.88) between two potential reference genes (ACTB and SDCBP). In D, the weakest correlation is depicted, which was found between the two tumor markers (CDK6 and TYMS).

