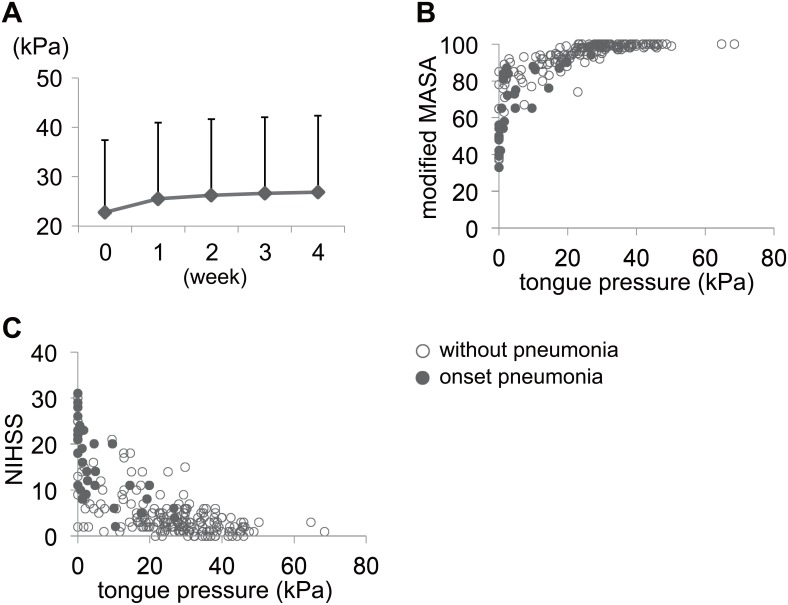
Fig 1. Tongue pressure time course and the association of tongue pressure with modified MASA and NIHSS scores.
The patients showed a significant increase in tongue pressure with repeated measurements during the observation period. The plot shows the mean values and the error bars indicate the standard deviation (A). An improvement in tongue pressure was observed over the first 2 weeks of hospitalization. Scatter diagram of tongue pressure with modified MASA score (B) and NIHSS score (C) at admission is shown. Modified MASA score increased with tongue pressure elevation curvilinearly, and reached a stable state at a tongue pressure >21.6 kPa. The NIHSS score decreased with tongue pressure elevation but varied widely compared with the modified MASA score shown in the scatter diagram. ○, without pneumonia; ●, onset pneumonia.

