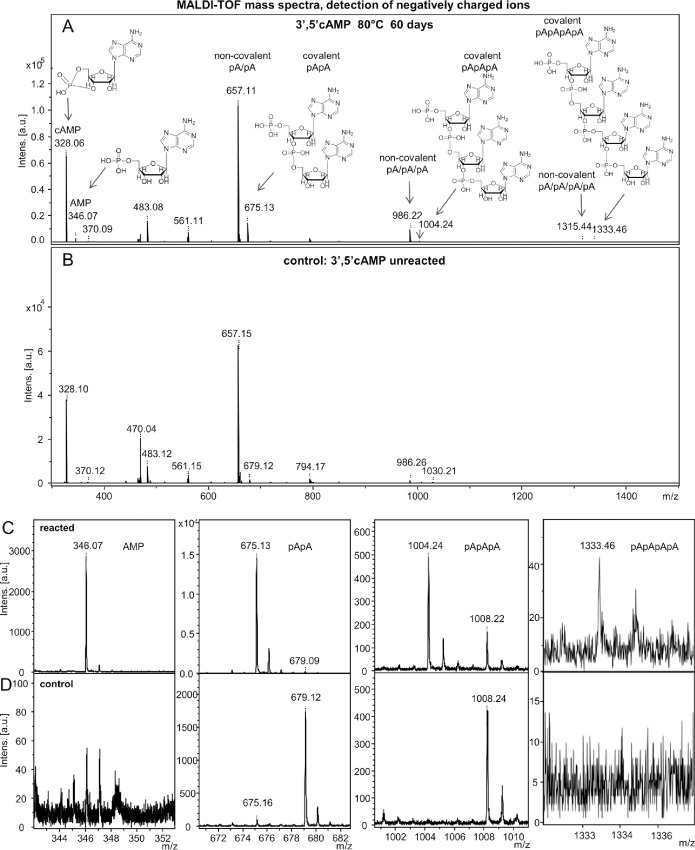
Fig 2. MALDI analysis of the reaction products obtained by reacting 3’,5’ cAMP for 60 days, pH 7.0, 80°C.
Panel A: the overall pattern recorded for the reacted 3’,5’ cAMP sample. Panel B: spectrum of the unreacted sample. Panels C and D show the blow-ups of the relevant areas from panels A and B, respectively.

