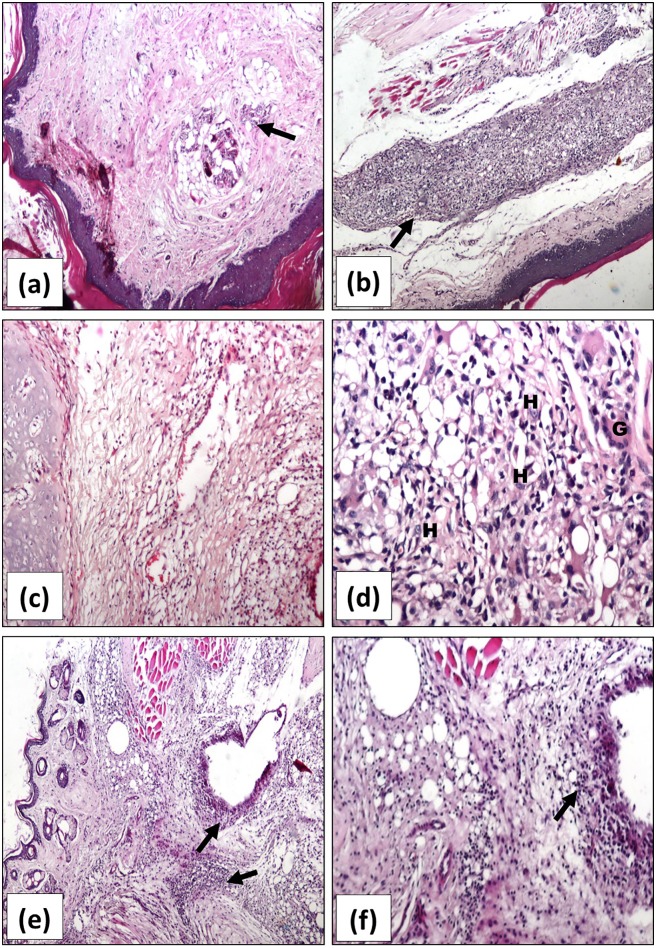
Fig 6.
Representative photomicrographs of H&E stained sections of rats’ right hind paws of ASMA-treated in (a-d) and ATSA-treated arthritis groups in (e) and (f), showing reduced joint inflammation with mild in (a) and localized moderate inflammation (↑) in (b) and (c) (x200). Mixed inflammatory infiltrates with giant cells (G) and histiocytes (H) are evident with high power x400 in (d). (e) and (f) show moderate inflammatory infiltration and edema of joints in ATSA-treated arthritis group (x200 and x400, respectively). ASMA; Autoclaved Schistosoma Mansoni antigen, ATSA; Autoclaved Trichinella Spiralis antigen.

