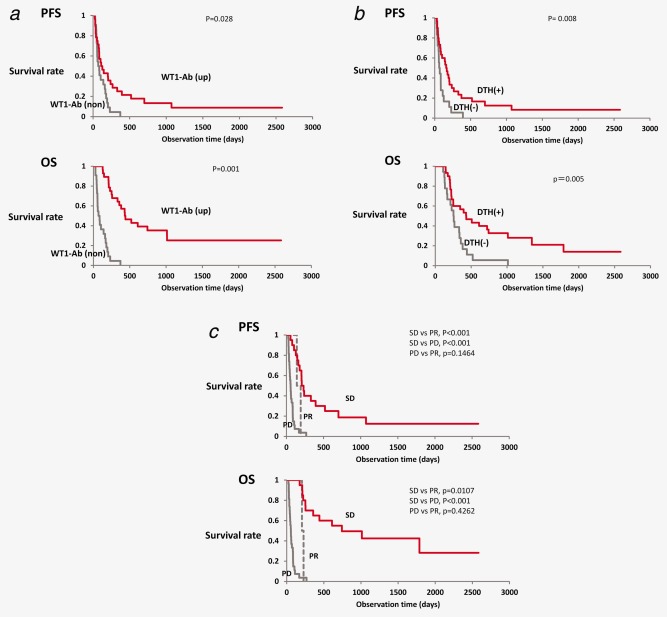
Figure 2.

Association of WT1 IgG antibody production with prolonged survival. Association of intermediate markers, such as serum WT1‐235 IgG levels (a), delayed‐type hypersensitivity (DTH) response to WT1 peptide (b), and clinical responses according to the Response Evaluation Criteria in Solid Tumors (RECIST) criteria (c), with progression‐free survival (PFS) and overall survival (OS) was analyzed by the log‐rank test. (a) Red and gray lines represent elevated (WT1 ab up) and nonelevated (WT1 ab non) serum WT1‐235 IgG antibody levels, respectively. (b) Red and gray lines represent positive and negative WT1‐DTH, respectively. (c) Red, gray dotted, and gray solid lines represent stable disease (SD), partial response (PR), and progressive disease (PD), respectively. [Color figure can be viewed in the online issue, which is available at wileyonlinelibrary.com.]
