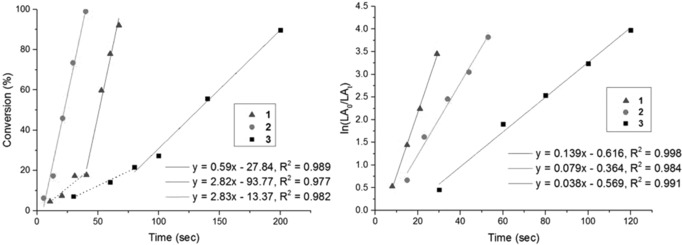
Figure 1.

LHS: Plot of rac‐LA conversion (%) versus time (s), using 1 (▲), 2 (•) and 3 (▪) (1000 equiv. of rac‐LA in THF, 25 °C, [rac‐LA]=1 m). Dotted lines represent the induction periods. RHS: Plot of ln([rac‐LA0]/[rac‐LAt]) versus time (s) under immortal conditions, using 1 (▲), 2 (•) and 3 (▪) (1000 equiv. rac‐LA in THF, at 25 °C, with 10 equiv. of IPA: [rac‐LA]=1 m).
