Figure 2.

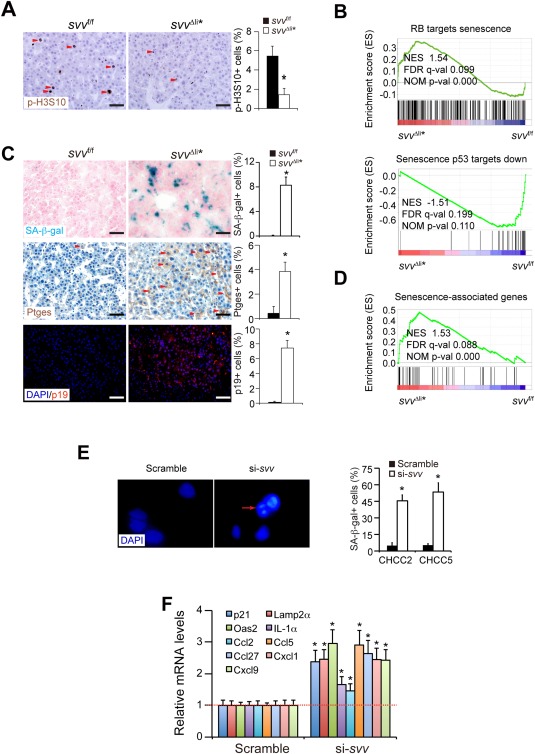
Survivin deficiency induces a mitosis defect and cellular senescence. (A) Mitotic HCC cells were analyzed by immunohistochemical staining for phosphorylated H3S10 (p‐H3S10). HCCs were harvested 1 week after poly(IC)‐induced Survivin depletion. (B) GSEA analysis showed that the expression profile of RB‐related senescence and p53‐related senescence were enriched in svv Δli* liver cancers. (C) SA‐β‐gal staining (blue) on cryosections of HCCs from svv Δli* mice 1 week after polyIC treatment. SA‐β‐gal‐positive HCC cells were quantified. Cancer cells expressing senescence marker genes Ptges and p19Arf were determined by immune staining on paraffin sections. Arrowheads indicate Ptges‐positive cancer cells. Quantification of Ptges‐ and p19Arf‐positive cancer cells are shown. n = 4 for each group for (A) and (C). (D) GSEA of expression profiles of senescence‐associated genes in DEN‐induced HCCs from svv f/f and svv Δli* mice 1 week after poly(IC) treatment. Senescence‐associated genes were taken from the study of Pribluda et al.28 (E) Two primary human HCC cells were transfected with Survivin‐specific siRNAs to silence Survivin. SAHFs were characterized by DAPI‐DNA staining. SAHF are indicated by arrows. SA‐β‐gal‐positive cells were quantified 72 hours after siRNA transfection. All results represent three independent experiments. * P < 0.05, t test. (F) qPCR analysis of senescence‐associated genes in Survivin‐silenced human HCC cells. Results represent three independent experiments. Scale bars, 50 μm. * P < 0.05, t test. Abbreviations: DAPI, 4′,6‐diamidino‐2‐phenylindole; FDR, false discovery rate; NES, normalized enrichment score; NOM, nominal.
