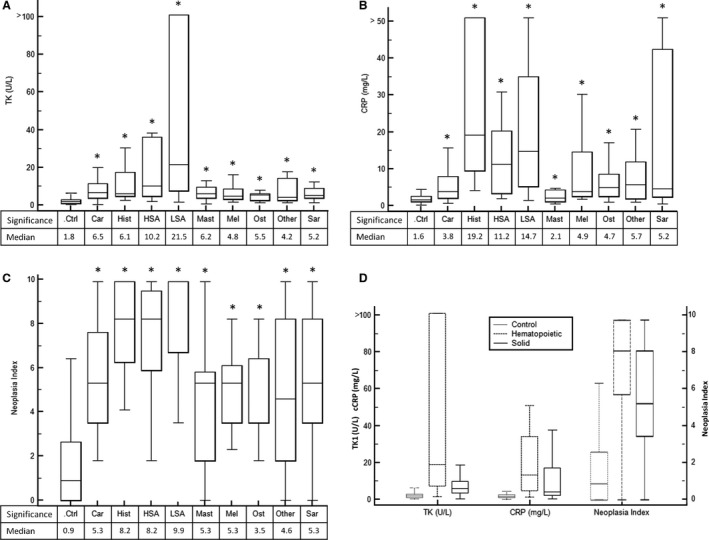
Figure 1.

(A) Box and whiskers plot of serum TK1 activity for dogs in control and cancer groups. Groups that were statistically different (P < .05) than the control group are indicated by *. (B) Box and whiskers plot of serum cCRP for dogs in control and cancer groups. Groups that were statistically different (P < .05) than the control group are indicated by *. (C) Box and whiskers plot of Neoplasia Index for dogs in control and cancer groups. Groups that were statistically different (P < .05) than the control group are indicated by *. (D) Box and whiskers plot of TK1, cCRP, and Neoplasia Index for control, hematopoietic, and solid tumors.
