
Figure 2.
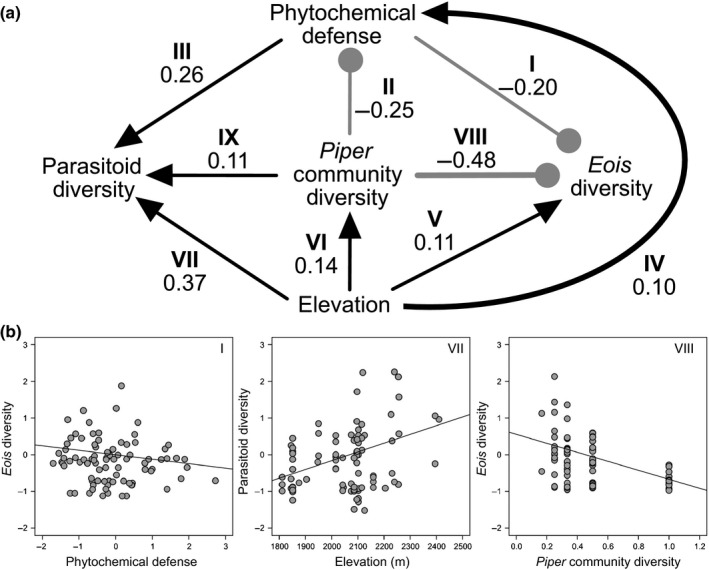
Results of a structural equation model depicting hypothesized causal relationships between: phytochemical defense (latent variable), Eois diversity per P. kelleyi plant, parasitoid diversity per P. kelleyi plant, Piper species diversity per plot, and elevation. (a) Illustration of the overall path model. The direct positive effects are indicated by black arrows, while the direct negative effects are indicated by light gray blunt‐ended lines. The numbers beside the lines are the standardized path coefficients. The Roman numerals above the path coefficients relate to Table 1, which describes specific hypotheses being tested. Piper kelleyi phytochemical variation is a latent variable, created via factor analysis on relative abundances of the three defensive compounds with varimax rotation. The path coefficients are all significant (P < 0.05) and the model is a significant fit to the data (χ2 = 0.014; df = 1; P > 0.1). (b) A subset of the partial correlation plots from paths I, VII and VIII; the remaining partial correlation plots can be found in Supporting Information Fig. S2.