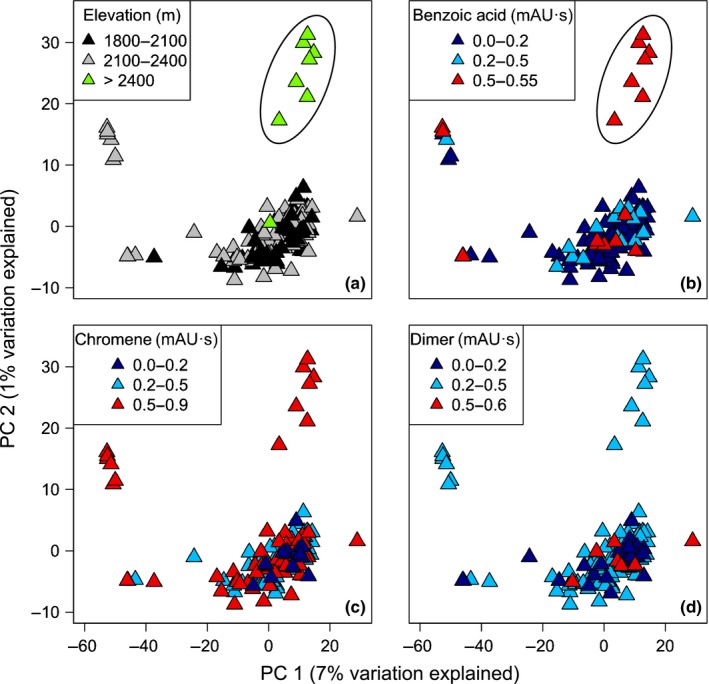
Figure 4.

Principal components analysis illustrates genetic variation and structure across populations of Eois encina moths. Points represent genotypic data for 20 458 single nucleotide polymorphisms (SNPs) in each individual. The first two principal components (PCs) explained 7% (PC1) and 1% (PC2) of the genotypic variation across all individuals and loci and revealed previously undetected genetic differentiation in high‐elevation populations. Black circles denote individuals exhibiting genetic differentiation, which is correlated with high elevation and benzoic acid concentrations in plants. (a–d) Panels are the same principal components analysis, but differ in the overlaid gradient. Panel (a) illustrates an elevation gradient, with black being the lowest elevation and green being the highest elevation; (b–d) illustrate the prenylated benzoic acid, chromane and dimeric chromane concentration gradients, respectively. Dark blue is the lowest concentration, while red is the highest concentration.
